Delivery Operations Platform
A live-data dashboard for B2B SaaS customer success — SLA tracking, PM scorecards, automated Slack digests, internal ticketing, AI-assisted triage. ~10K LOC across single-page web app + Python automation + Cloudflare Workers + GitHub Actions cron.
DEMO-#### / INT-####). The production system this mirrors is closed-source. Architecture, math, and workflows are real; nothing identifiable has been published.
This is the delivery-operations tool I co-built with Claude (Anthropic) as pair-programmer over 50+ iterations during my time as Customer Operations Lead. It replaced ~150 hours/month of manual collation across three spreadsheets, eliminated the daily-digest authoring task entirely, and surfaces SLA breach risk before it lands on the CS team's radar.
Day to day, the platform handles a portfolio of 50+ enterprise clients on a Voice AI system that runs 1M+ calls per day. The dashboard is what the CS team and PMs actually look at — SLA breach tracking, ticket assignment, follow-up history, weekly PM accountability metrics, and the daily Slack digest preview before it ships.
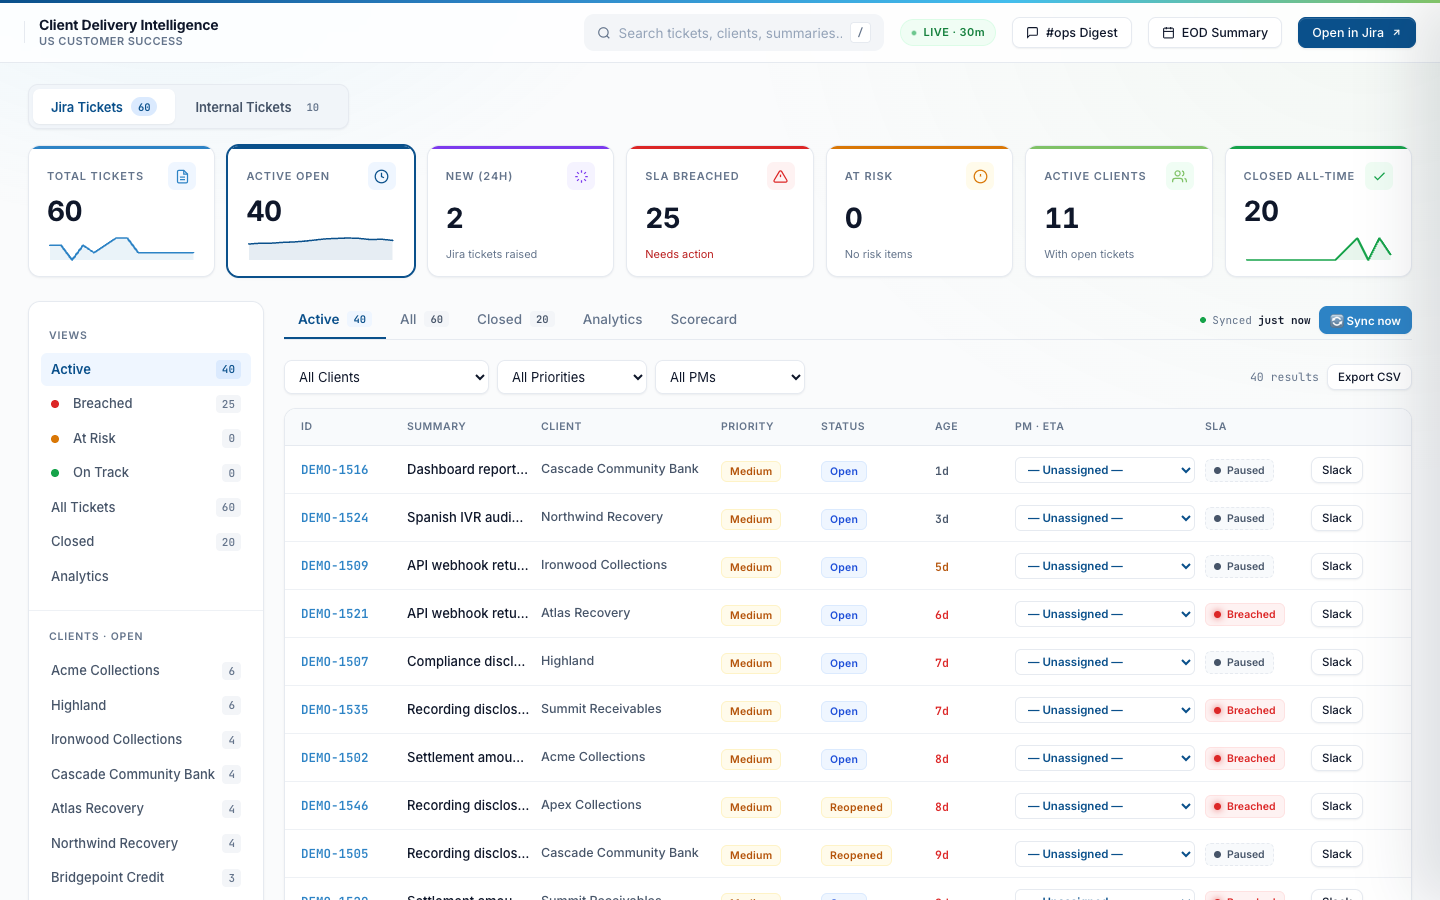
The home view — KPI tiles, filter pills, ticket table
Open the dashboard and the first thing you see is the state of the whole portfolio. KPI tiles up top, status filters on the left, and a paginated table with full client/PM/priority/RAG-status filtering, search, and sortable columns. State (filter + sort + tab) persists across sessions in localStorage.
Active tickets — default landing view
60 total tickets, 40 actively open, 25 with at least one SLA clock breached, 11 clients with current load. Each row shows ticket ID, summary, client, priority, status, age, PM assignment, and SLA RAG status. The colored stripe on each KPI tile reflects the metric’s health.
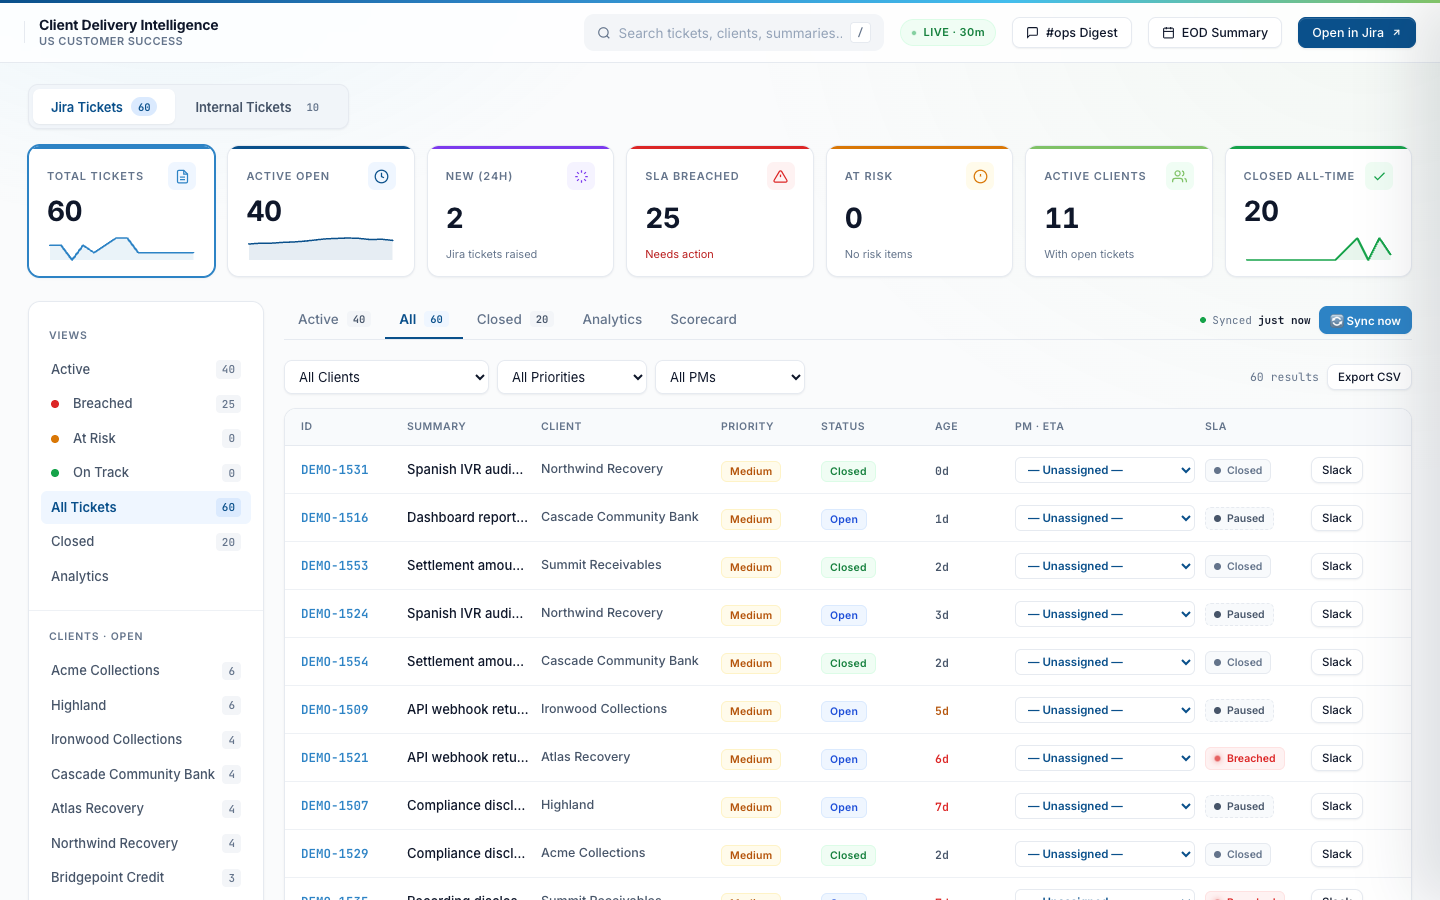
All tickets — including closed
Switches scope to all tickets (Open + Reopened + Closed). The same filter and sort affordances apply. Closed tickets stay searchable for post-mortems and historical client checks.
One-click filter by client
Click a client name in the sidebar (or pick from the dropdown) and the table narrows to that account. Useful for “what does Meridian look like right now?” conversations during the weekly client review.

Three SLA clocks per ticket, business-hours-aware
The SLA engine tracks three independent clocks per external ticket (First Response, First Update, Time to Resolve) against per-priority targets, with a 12-hour business-hours window (14:00–02:00 IST, Mon–Fri). Internal tickets get two clocks (no First Response — they bypass that contract). Auto-pause when state flips to awaiting_customer; auto-resume when the customer replies.
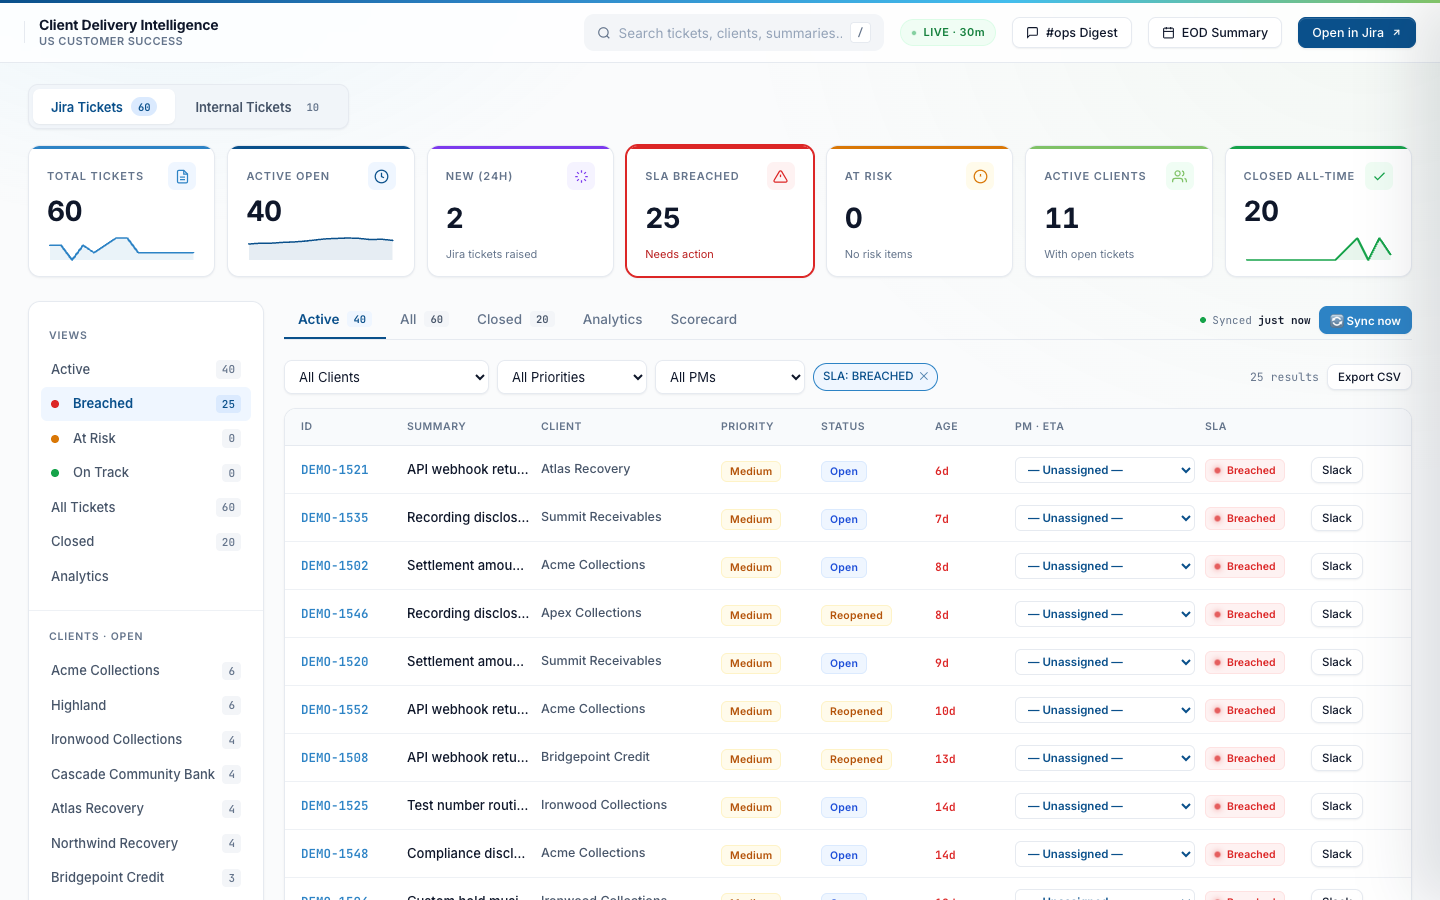
SLA-breached filter — the daily triage view
One click on “SLA Breached” narrows to tickets that have blown at least one clock. Red chips and per-clock overshoot labels (“+1.5d”, “+14h”) make the worst offenders obvious. PMs start their day here.
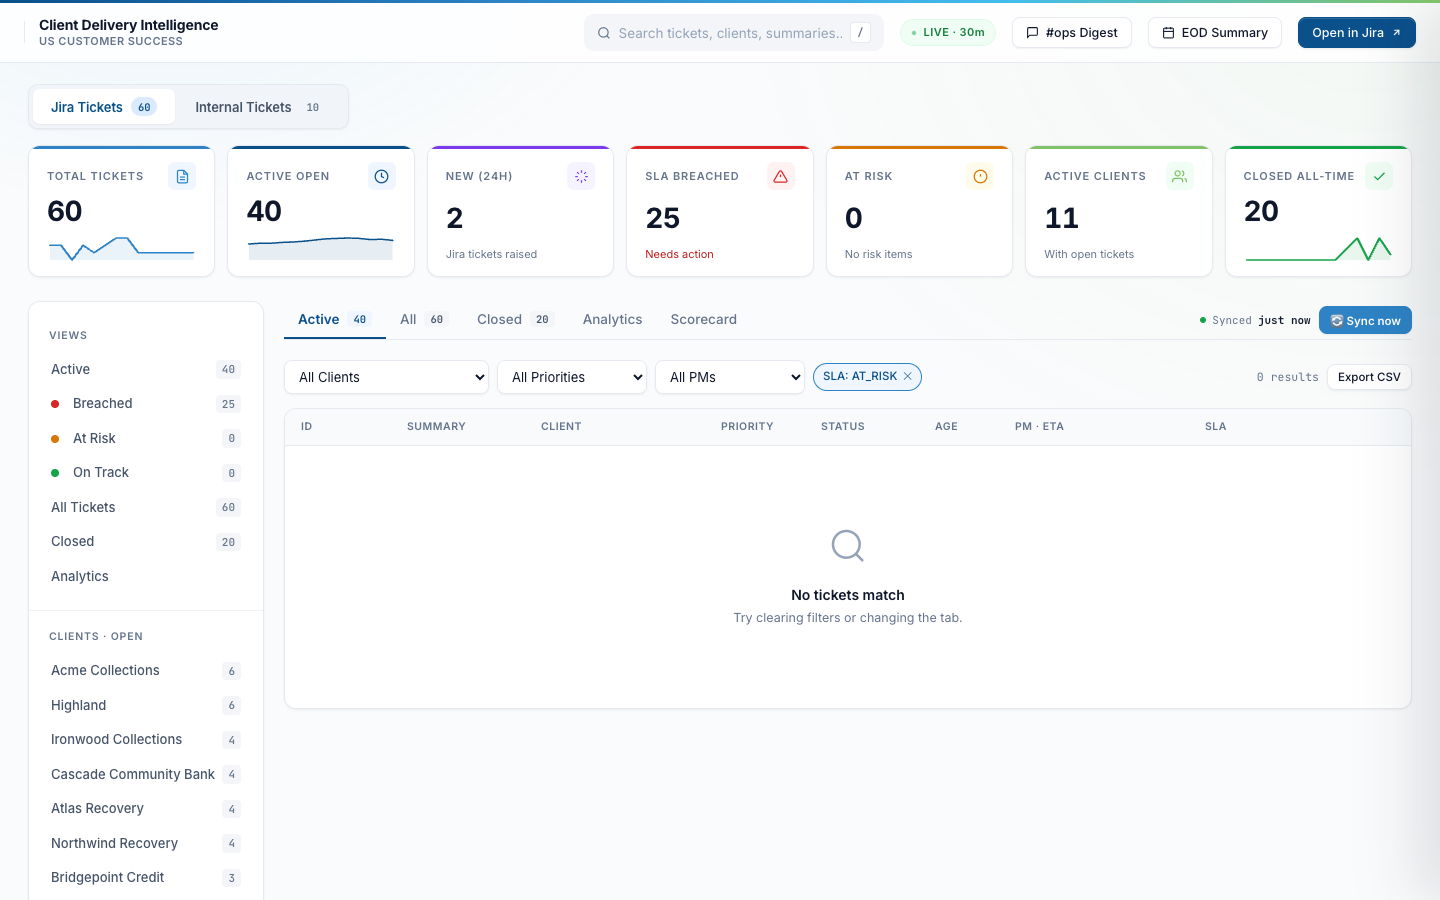
At-Risk filter — before it breaches
“At Risk” surfaces tickets that have used 80%+ of their SLA target but haven’t breached yet. A breach-warner DM also pings the assigned PM in Slack so they can act before the chip turns red.
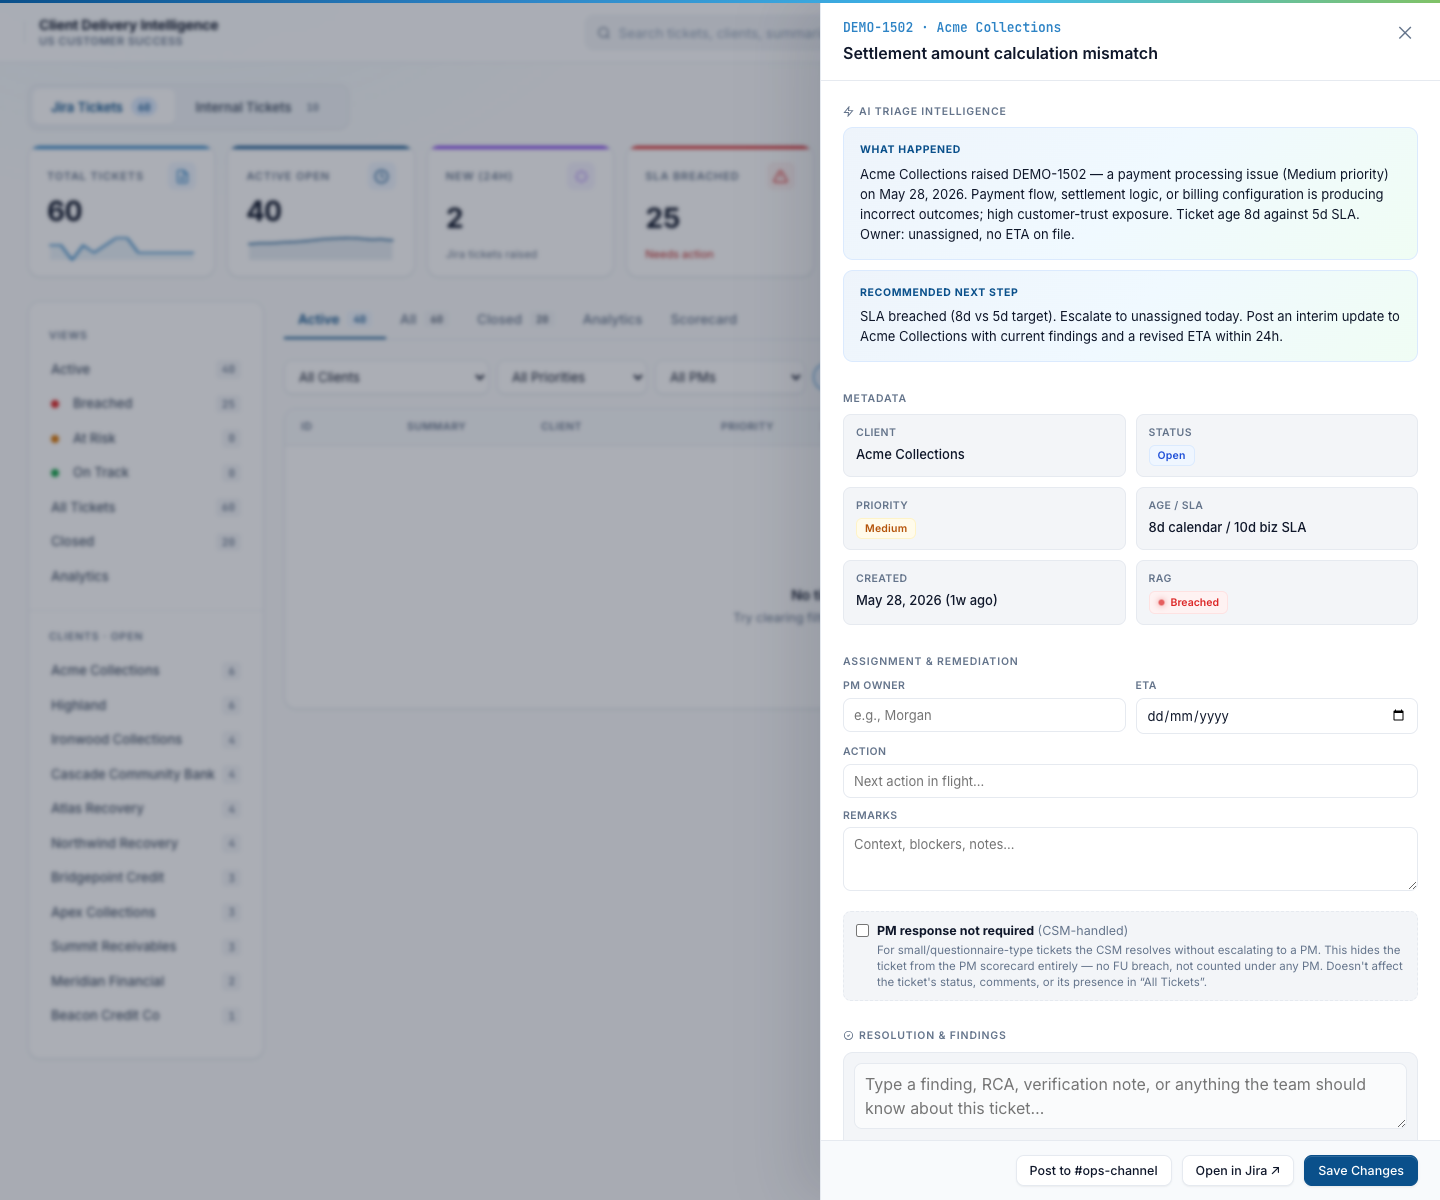
Ticket drawer — AI triage + 3-clock SLA panel
Click any ticket and a side drawer slides out. Top section shows the AI-generated “What happened” summary plus a “Recommended Next Step” that Claude synthesizes from the comment thread. Below that: full metadata, three SLA clocks with per-target overshoot, and the PM assignment / ETA / action editor.
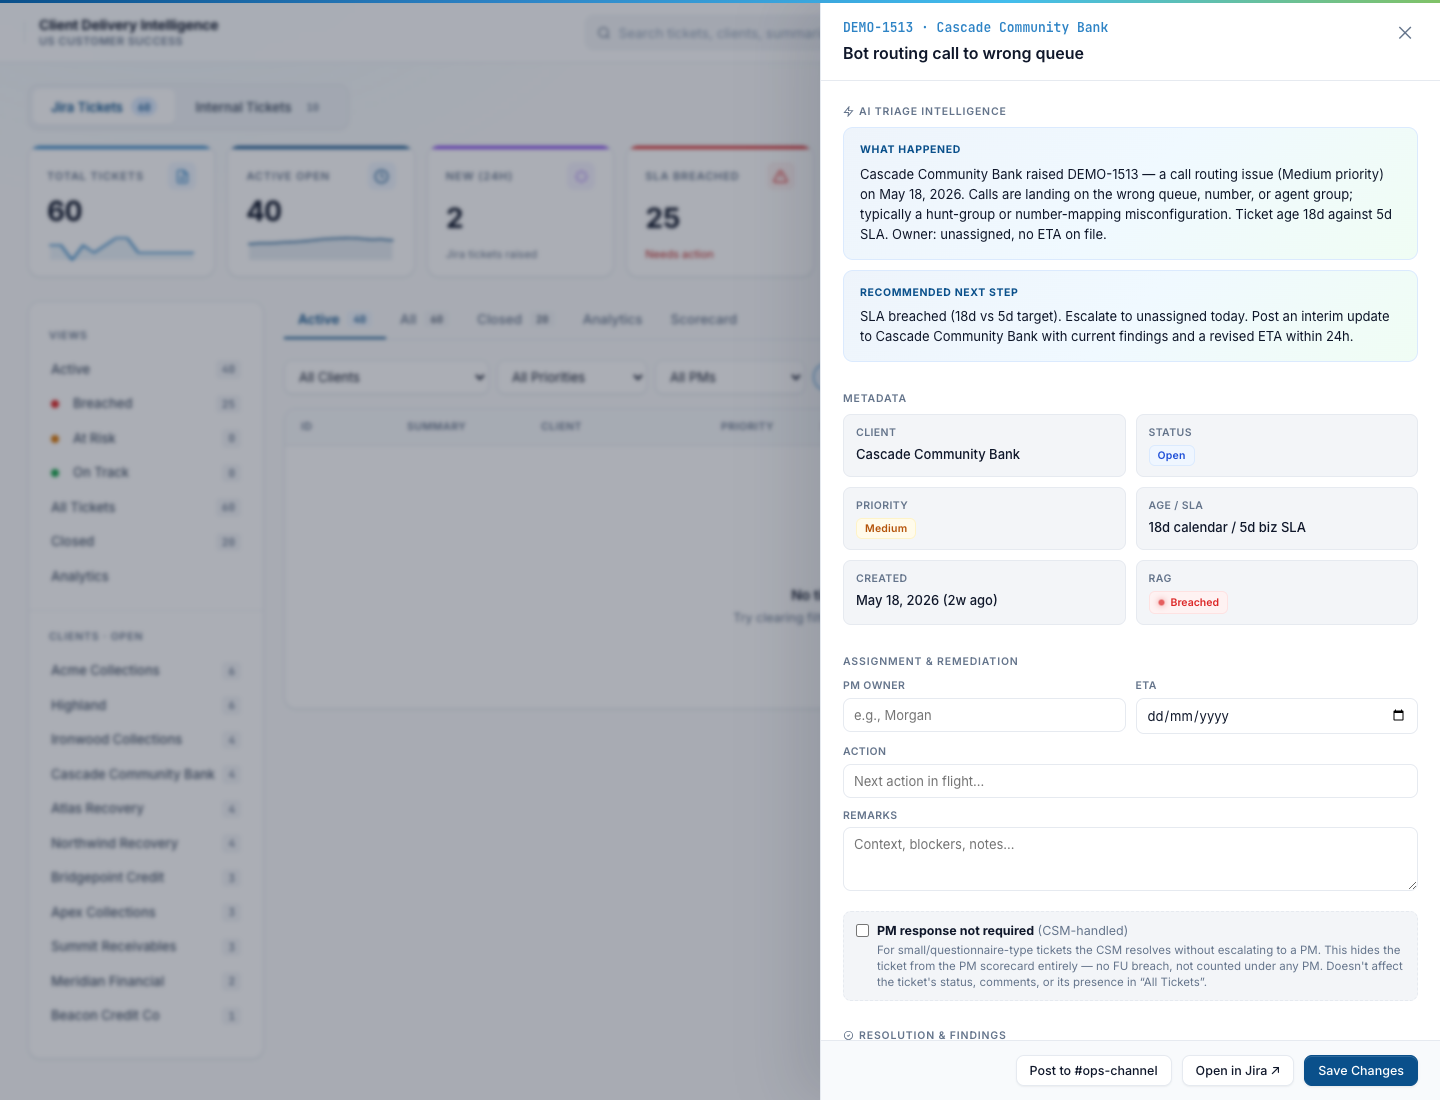
Drawer scrolled — assignment, RCA notes, csm_handled flag
Scroll the drawer down and you get the PM owner / ETA / action editor, the “PM response not required” (csm_handled) toggle for small or questionnaire-type tickets the CSM resolves without escalating, the RCA / resolution-notes thread, the related-links field, and a “Post to #ops-channel” button that drops a status update into the ticket’s Slack thread.
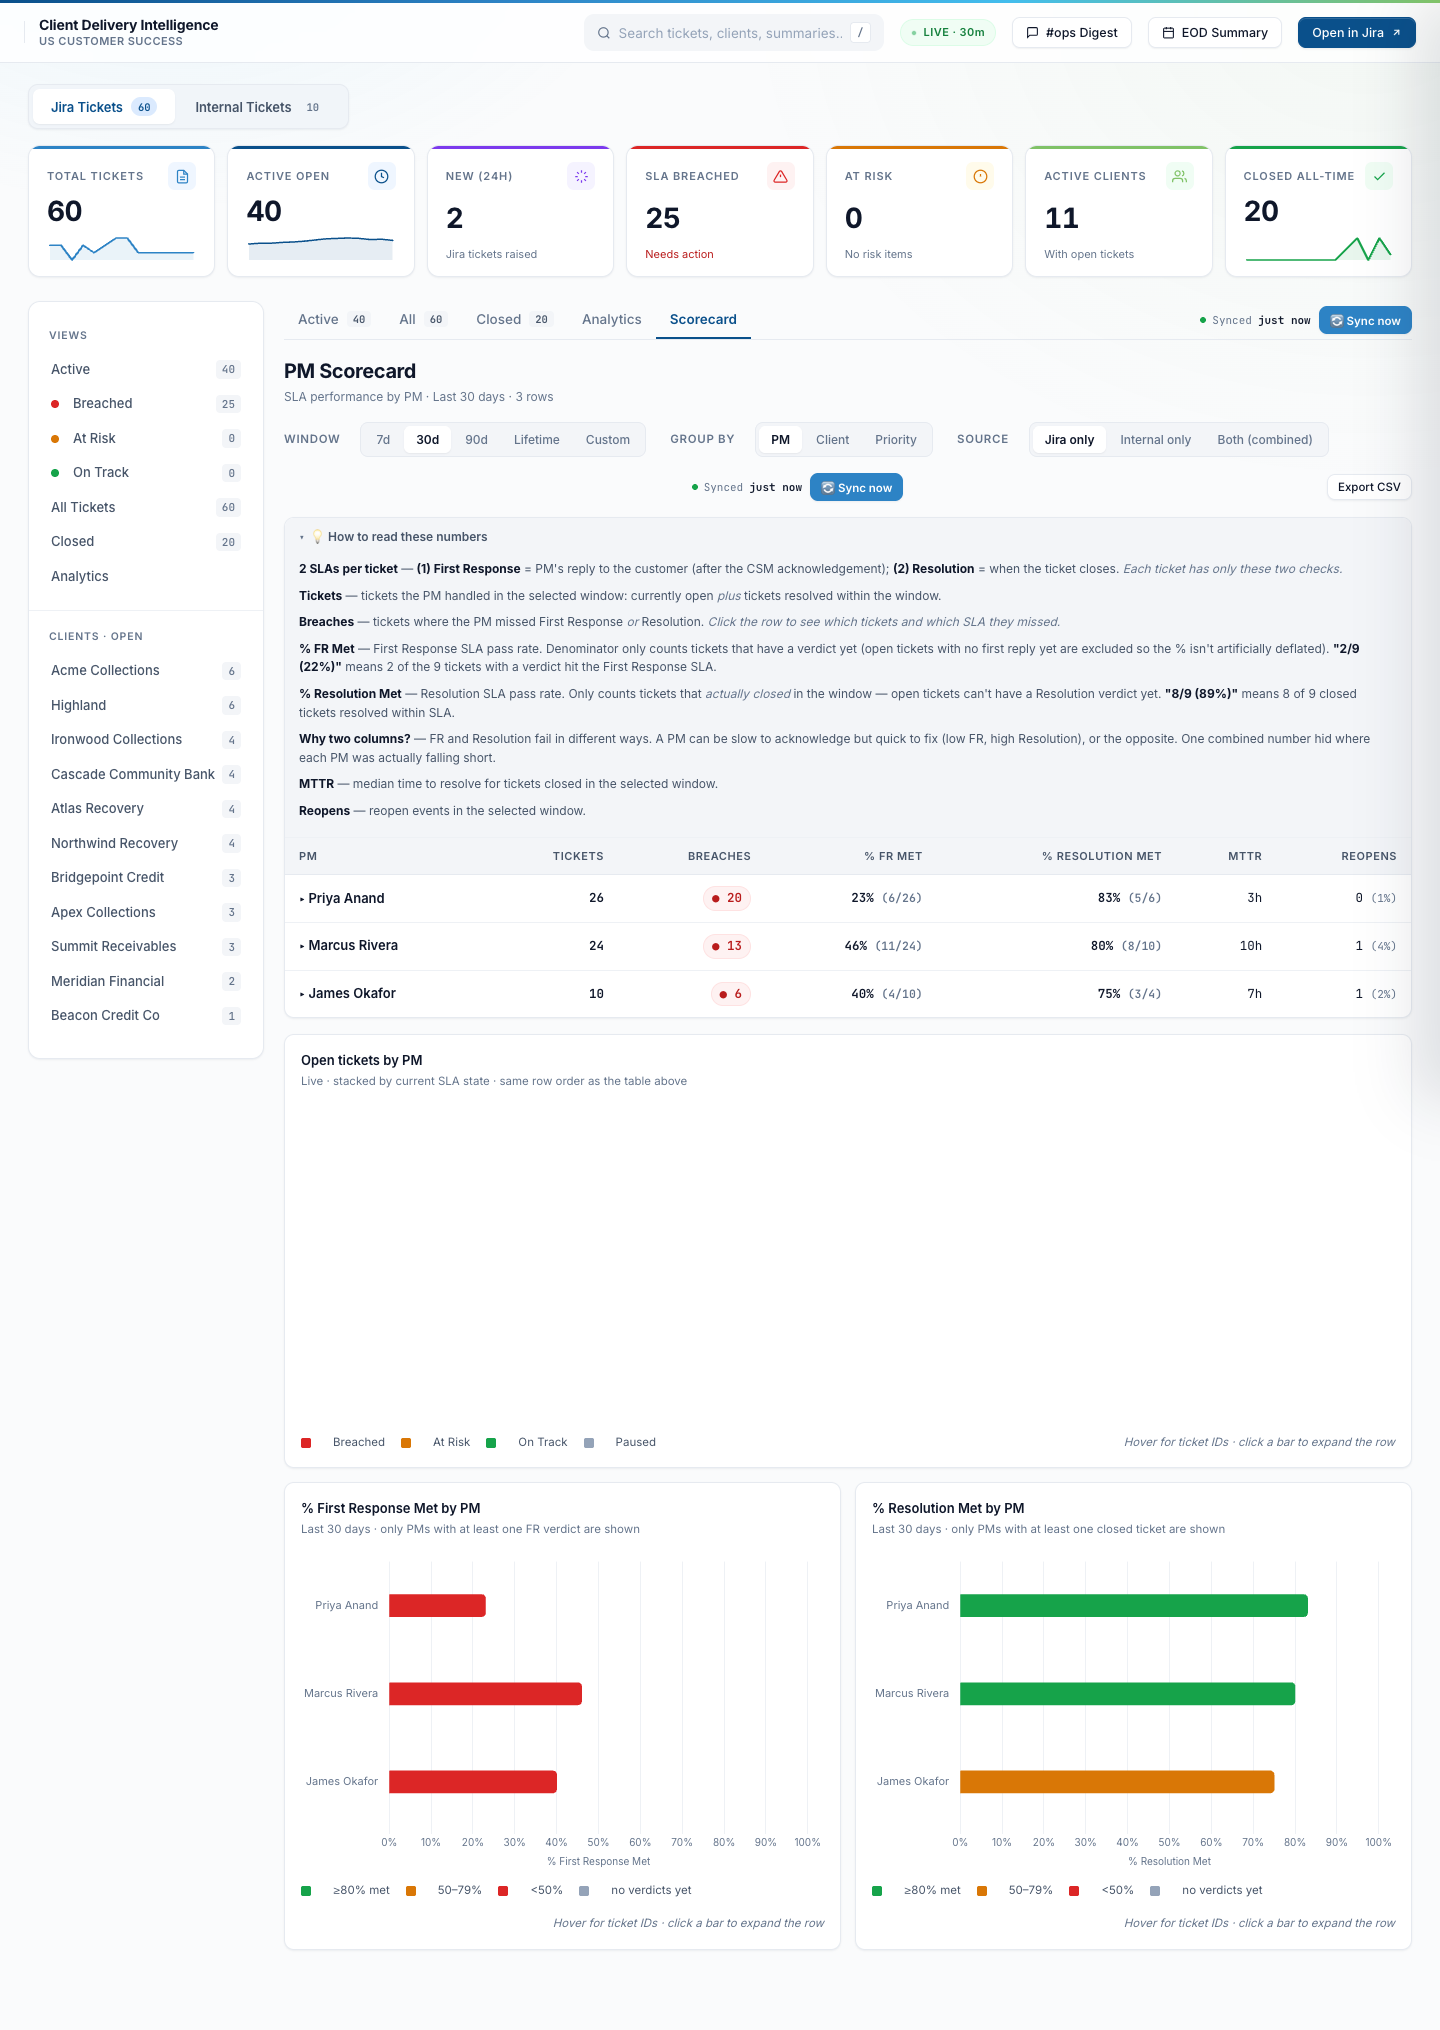
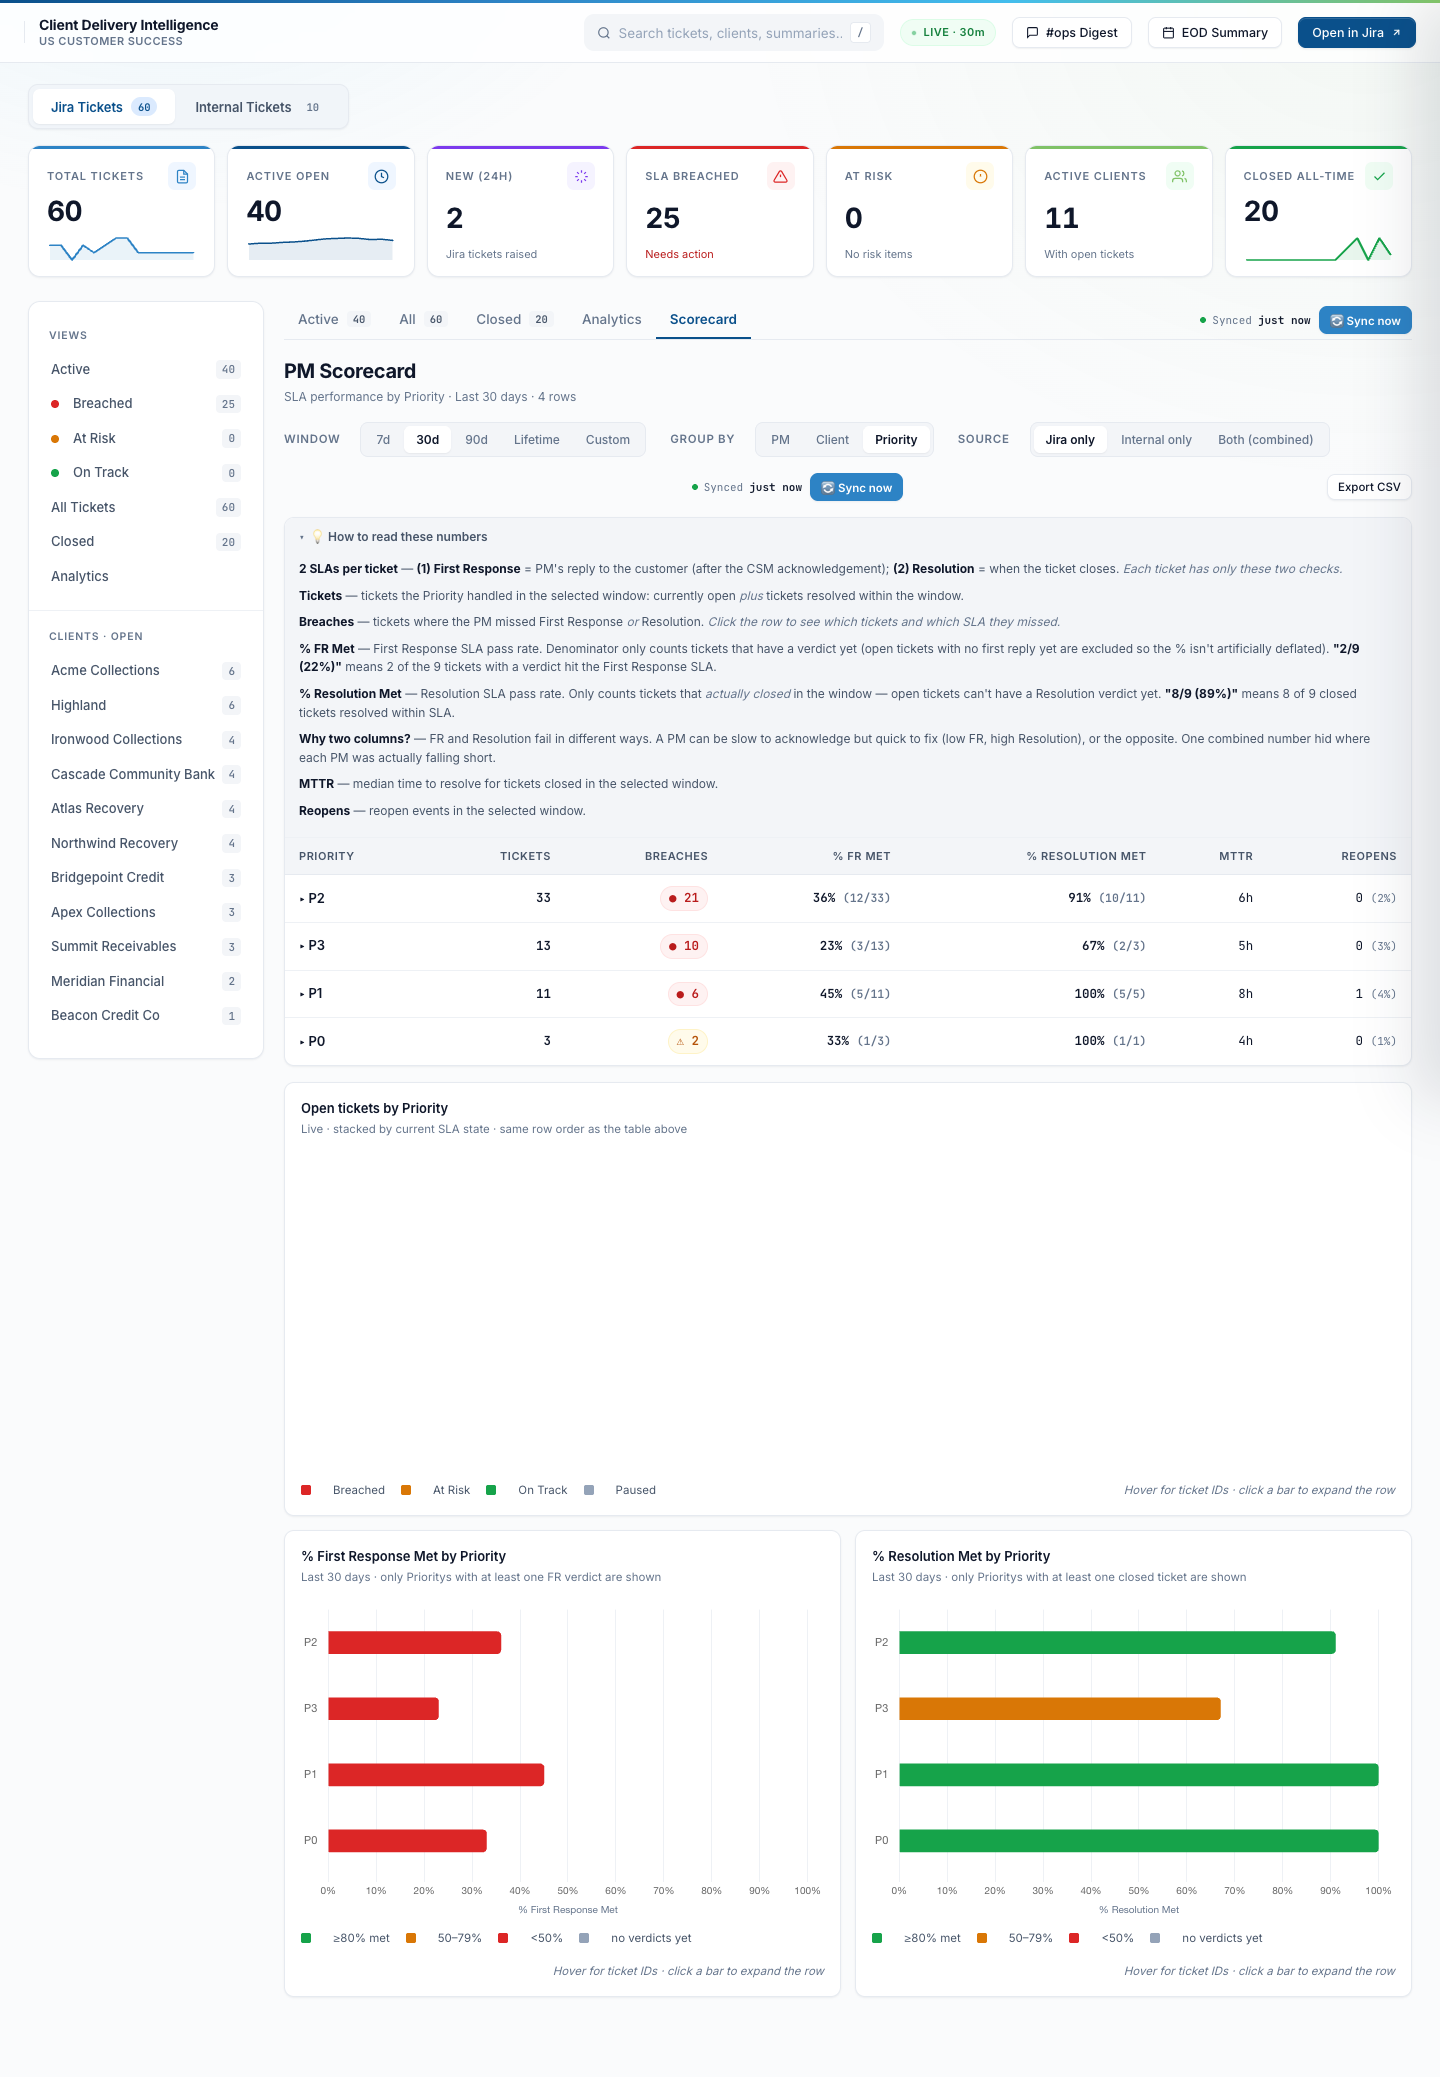
Per-PM, per-client, per-priority scorecard — what PMs use to track their own work
The Scorecard tab is what each PM opens to see how they’re tracking against their SLA contract. Switch the grouping between PM / Client / Priority. Switch the window between 7d / 30d / 90d / Lifetime / Custom range. Switch the workspace scope between Jira-only / Internal-only / Both combined. Tickets where the CSM handled without needing PM escalation are auto-excluded from PM accountability metrics so the numbers reflect actual PM workload — not random small things the CSM closed.
By PM — the weekly accountability view
Per PM: tickets handled, SLA breached, % First Response Met, % Resolution Met, MTTR, reopens, reopen rate. Bar charts below show open tickets per PM and per-PM First Response / Resolution pass rates side by side. Weekly snapshot runs every Thursday and posts to the team channel.
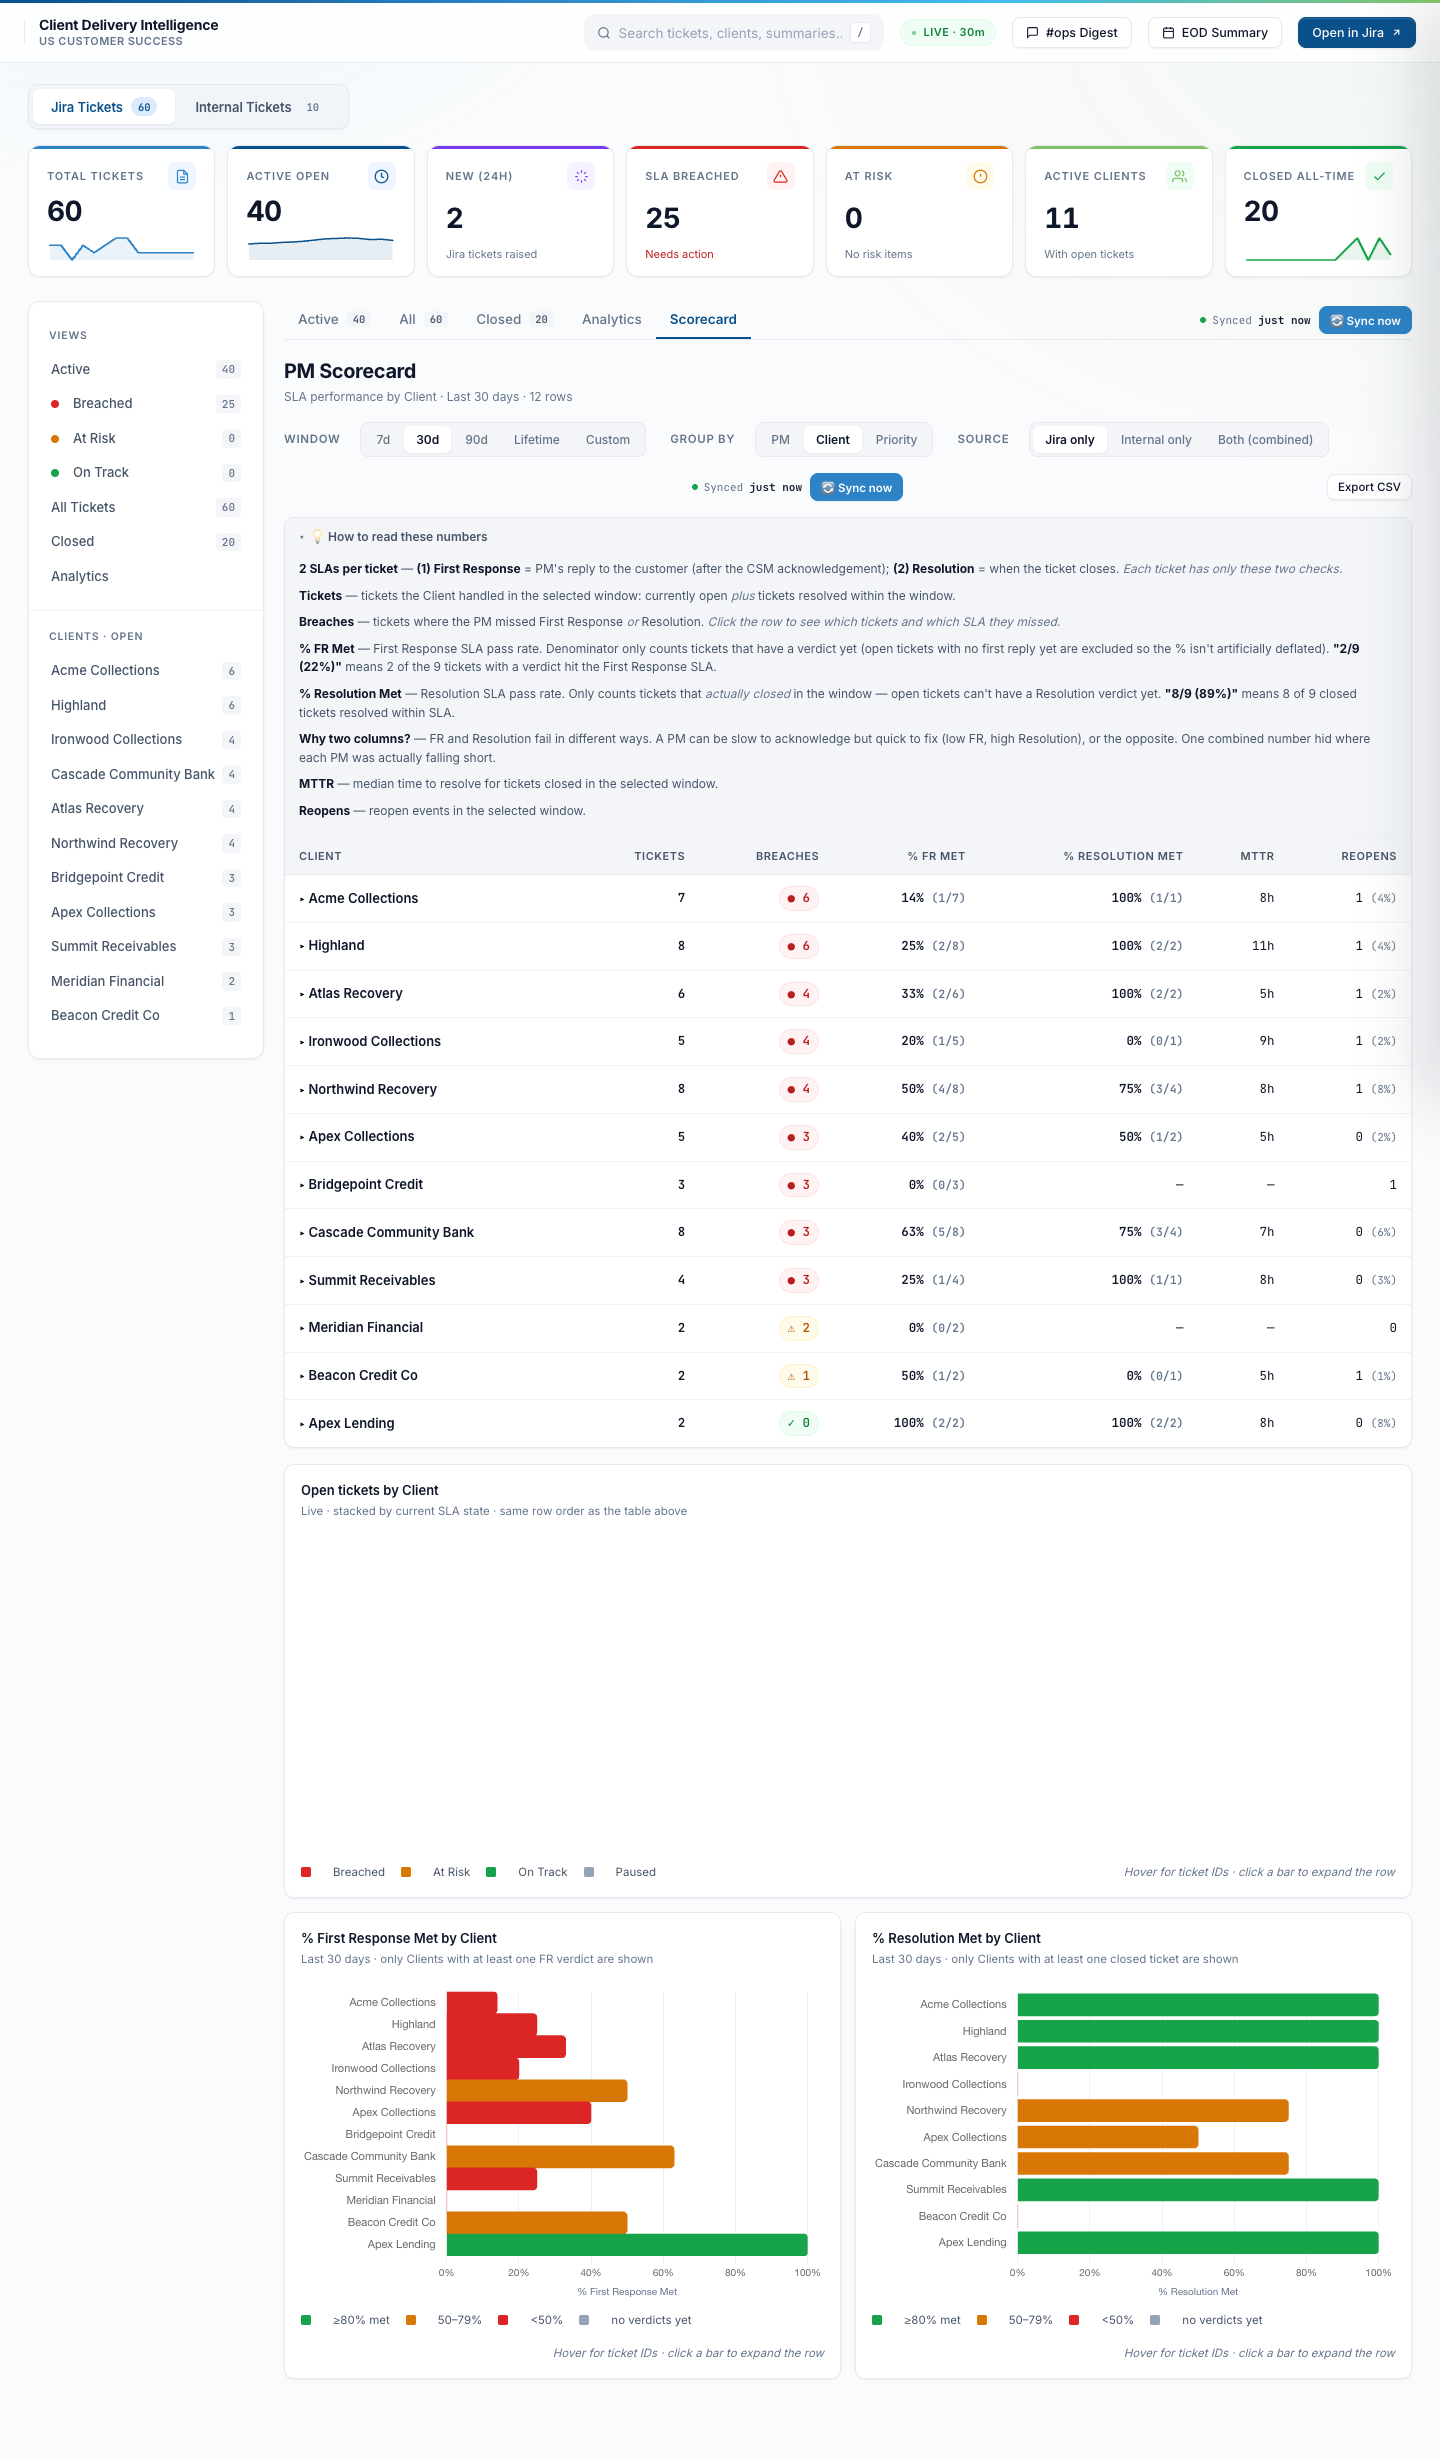
By Client — the client-health view
Same metrics, regrouped per client. Surfaces which accounts are running hot (lots of tickets, breaches piling up) vs which are quiet. Useful during QBR prep and renewal conversations.
By Priority — the SLA-contract view
Group by P0 / P1 / P2 / P3 to see how the team is performing against each priority’s SLA tier. P0 / P1 should be near-100% First Response Met; lower priorities have more headroom. Exposes whether priority calibration is honest.
Row drill-down — click a PM to see their tickets
Expand any row to see the ticket-by-ticket list that fed the numbers above. Each row links straight to the ticket drawer; the outcome chip (met / breached / in progress) matches what got counted.
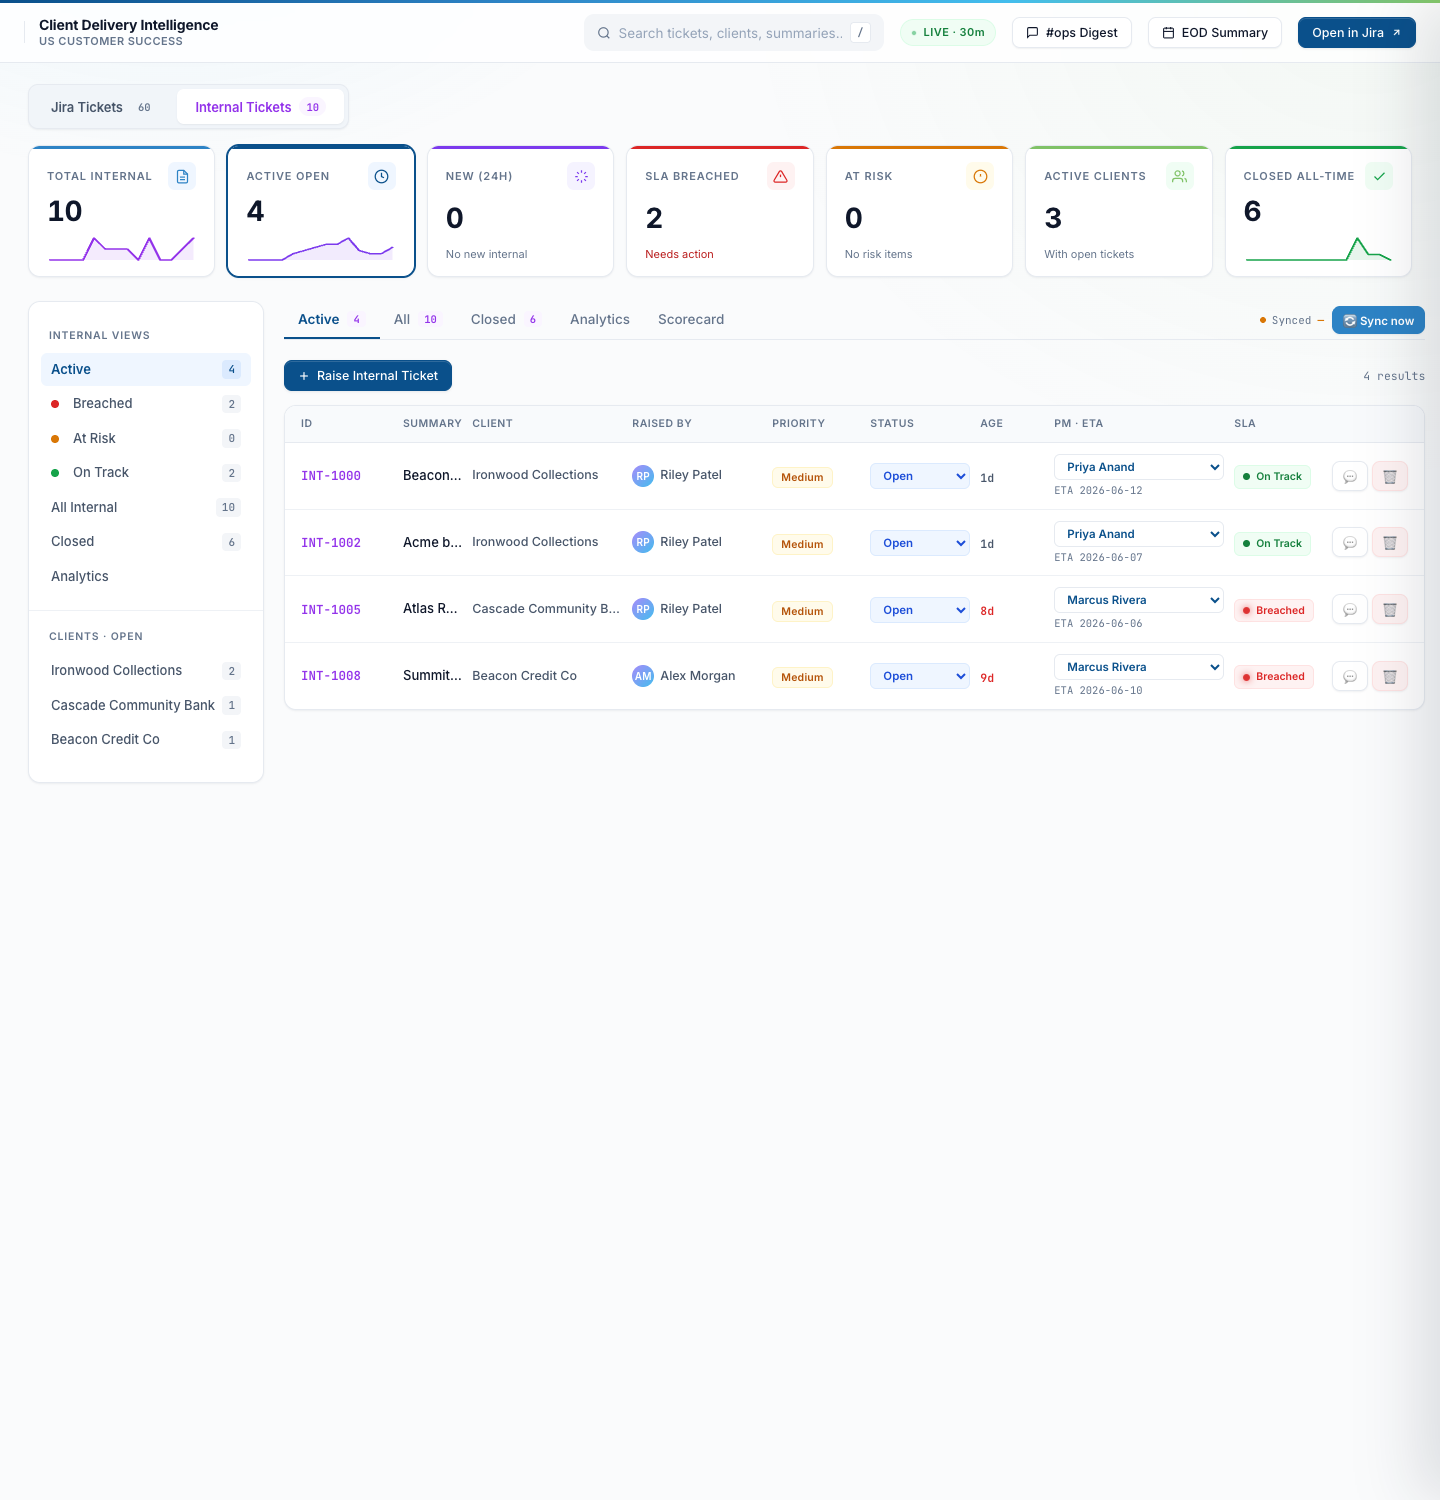
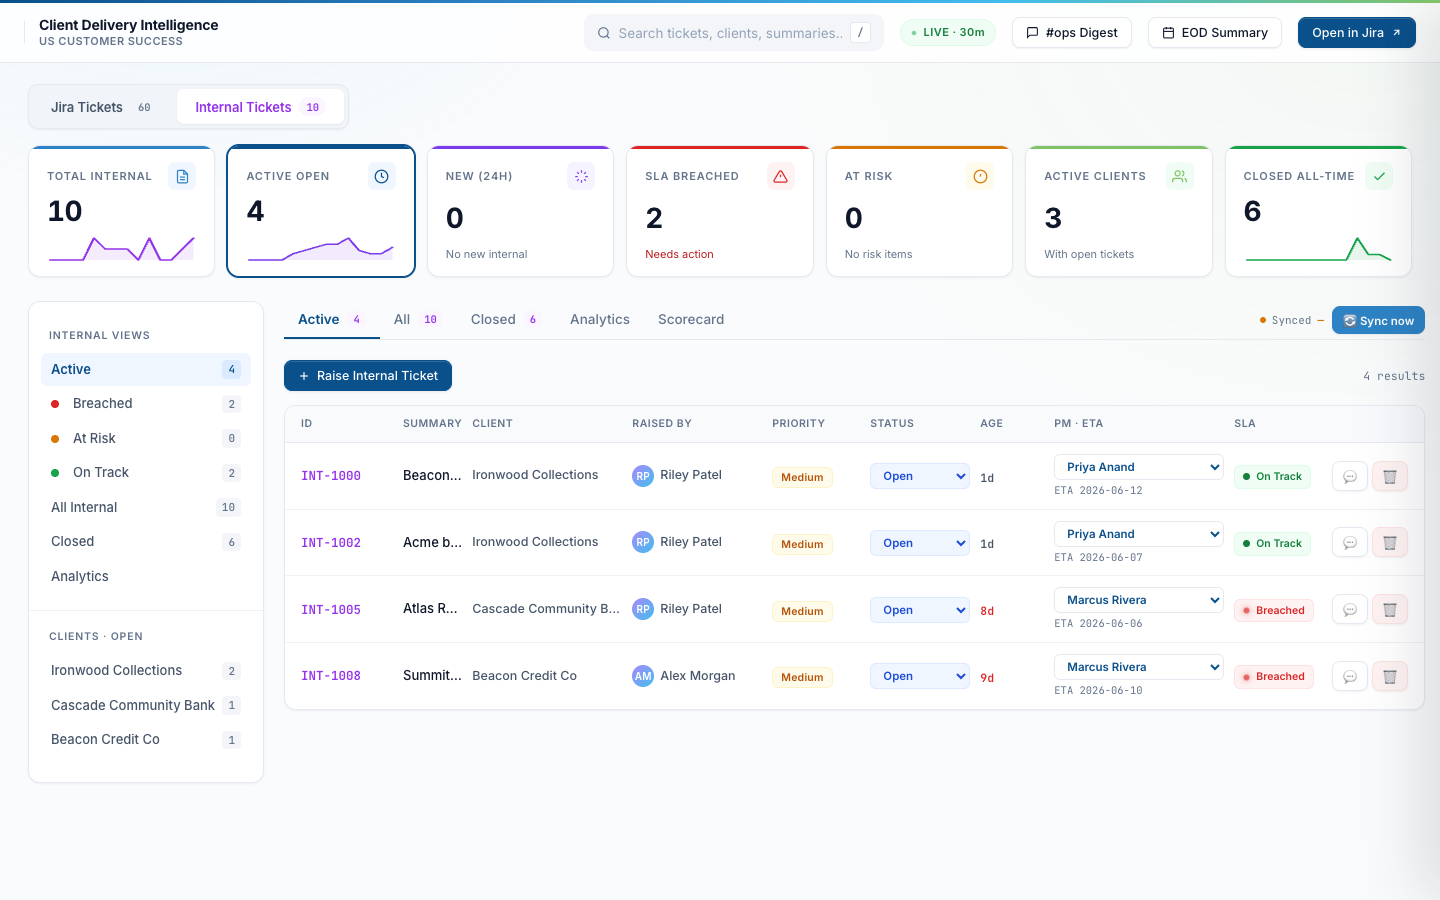
Separate workspace for issues the CSM raises herself
Internal tickets are issues a CSM or QA team member spots before any customer Jira exists — routing bugs, audio quality regressions, campaign config glitches. Lives in its own workspace with its own KPI tiles, filter sidebar, table, scorecard, and analytics. Two SLA clocks (no First Response). Never auto-pauses on awaiting_customer because there is no customer in the loop.
Internal tickets — same UI, separate state
10 active internal tickets across Ironwood Collections, Cascade Community Bank, Beacon Credit Co. Each ticket carries a “raised by” field so the team can ask the original raiser for context.
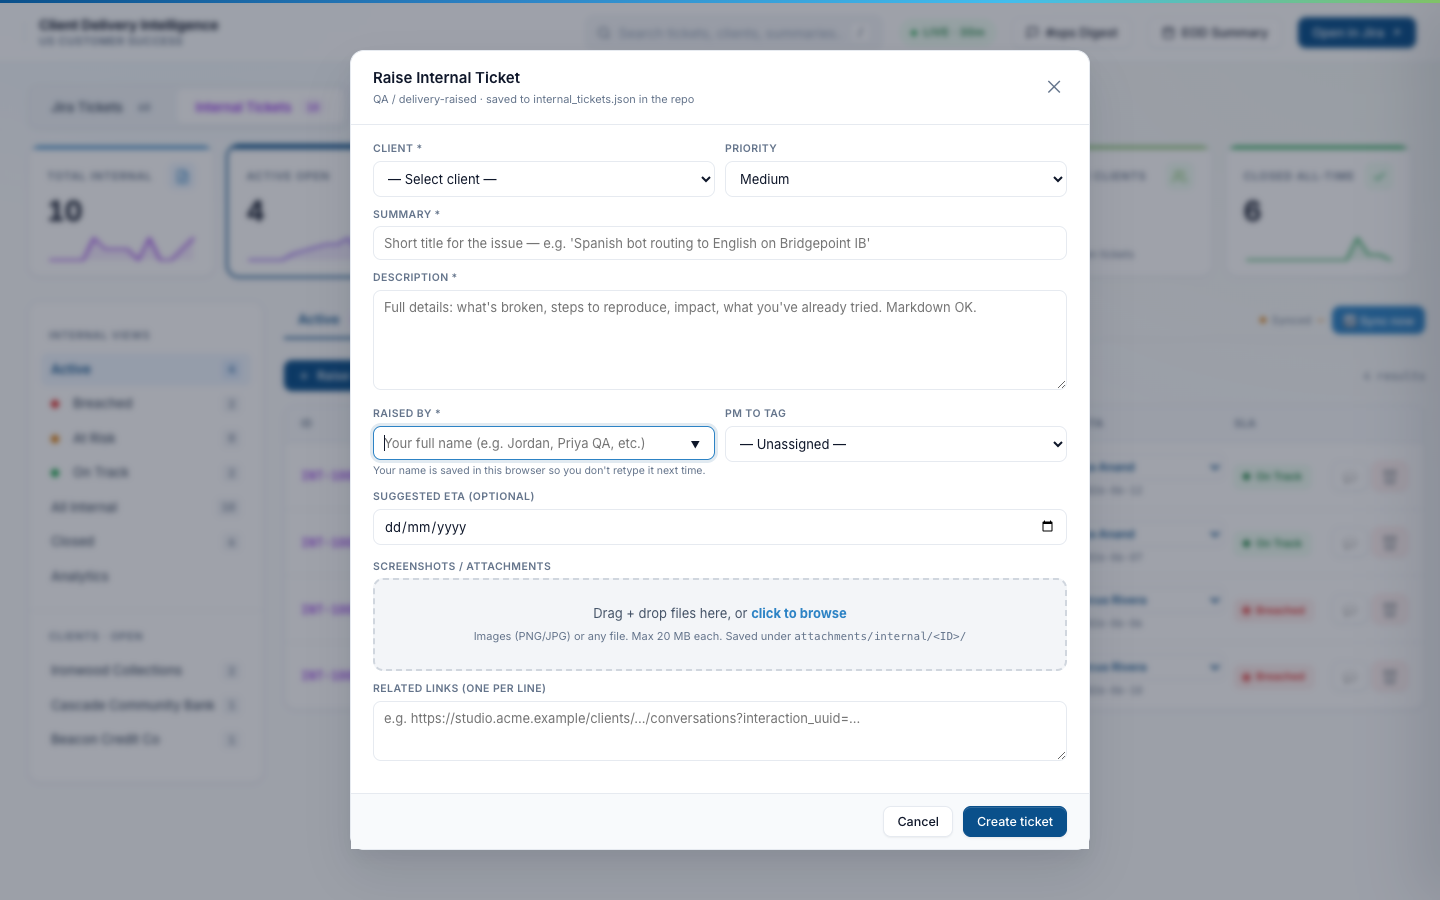
Raise Internal Ticket — modal form
Click “Raise Internal Ticket” from the table header to open this modal. Client + summary + description are required; priority defaults to Medium; ETA is optional; attachments and related links supported. A “Resolved → close” toggle on each ticket closes it inline once the fix lands. State is persisted to internal_tickets.json via a Cloudflare Worker write-proxy, so no GitHub token needed at the browser.
Daily ticket flow, priority mix, time-windowed KPIs
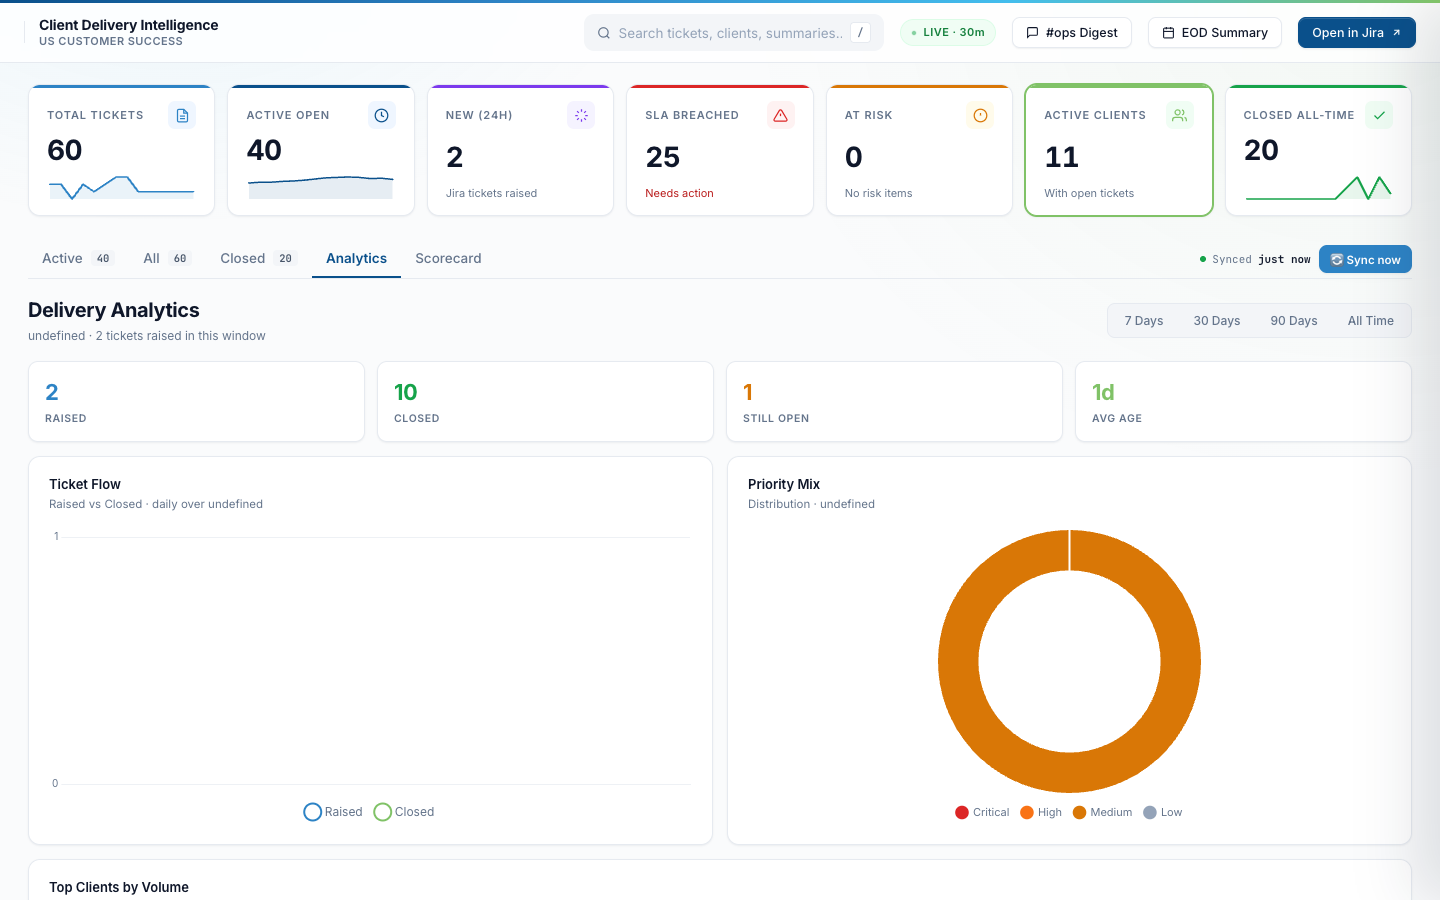
Switch to the Analytics tab for the time-windowed view. Daily raised-vs-closed flow chart, priority distribution donut, KPI tiles for the selected window. Useful in the monthly delivery review to spot trends — is the team raising more tickets than they’re closing? Which priority is growing?
Analytics — 30-day window
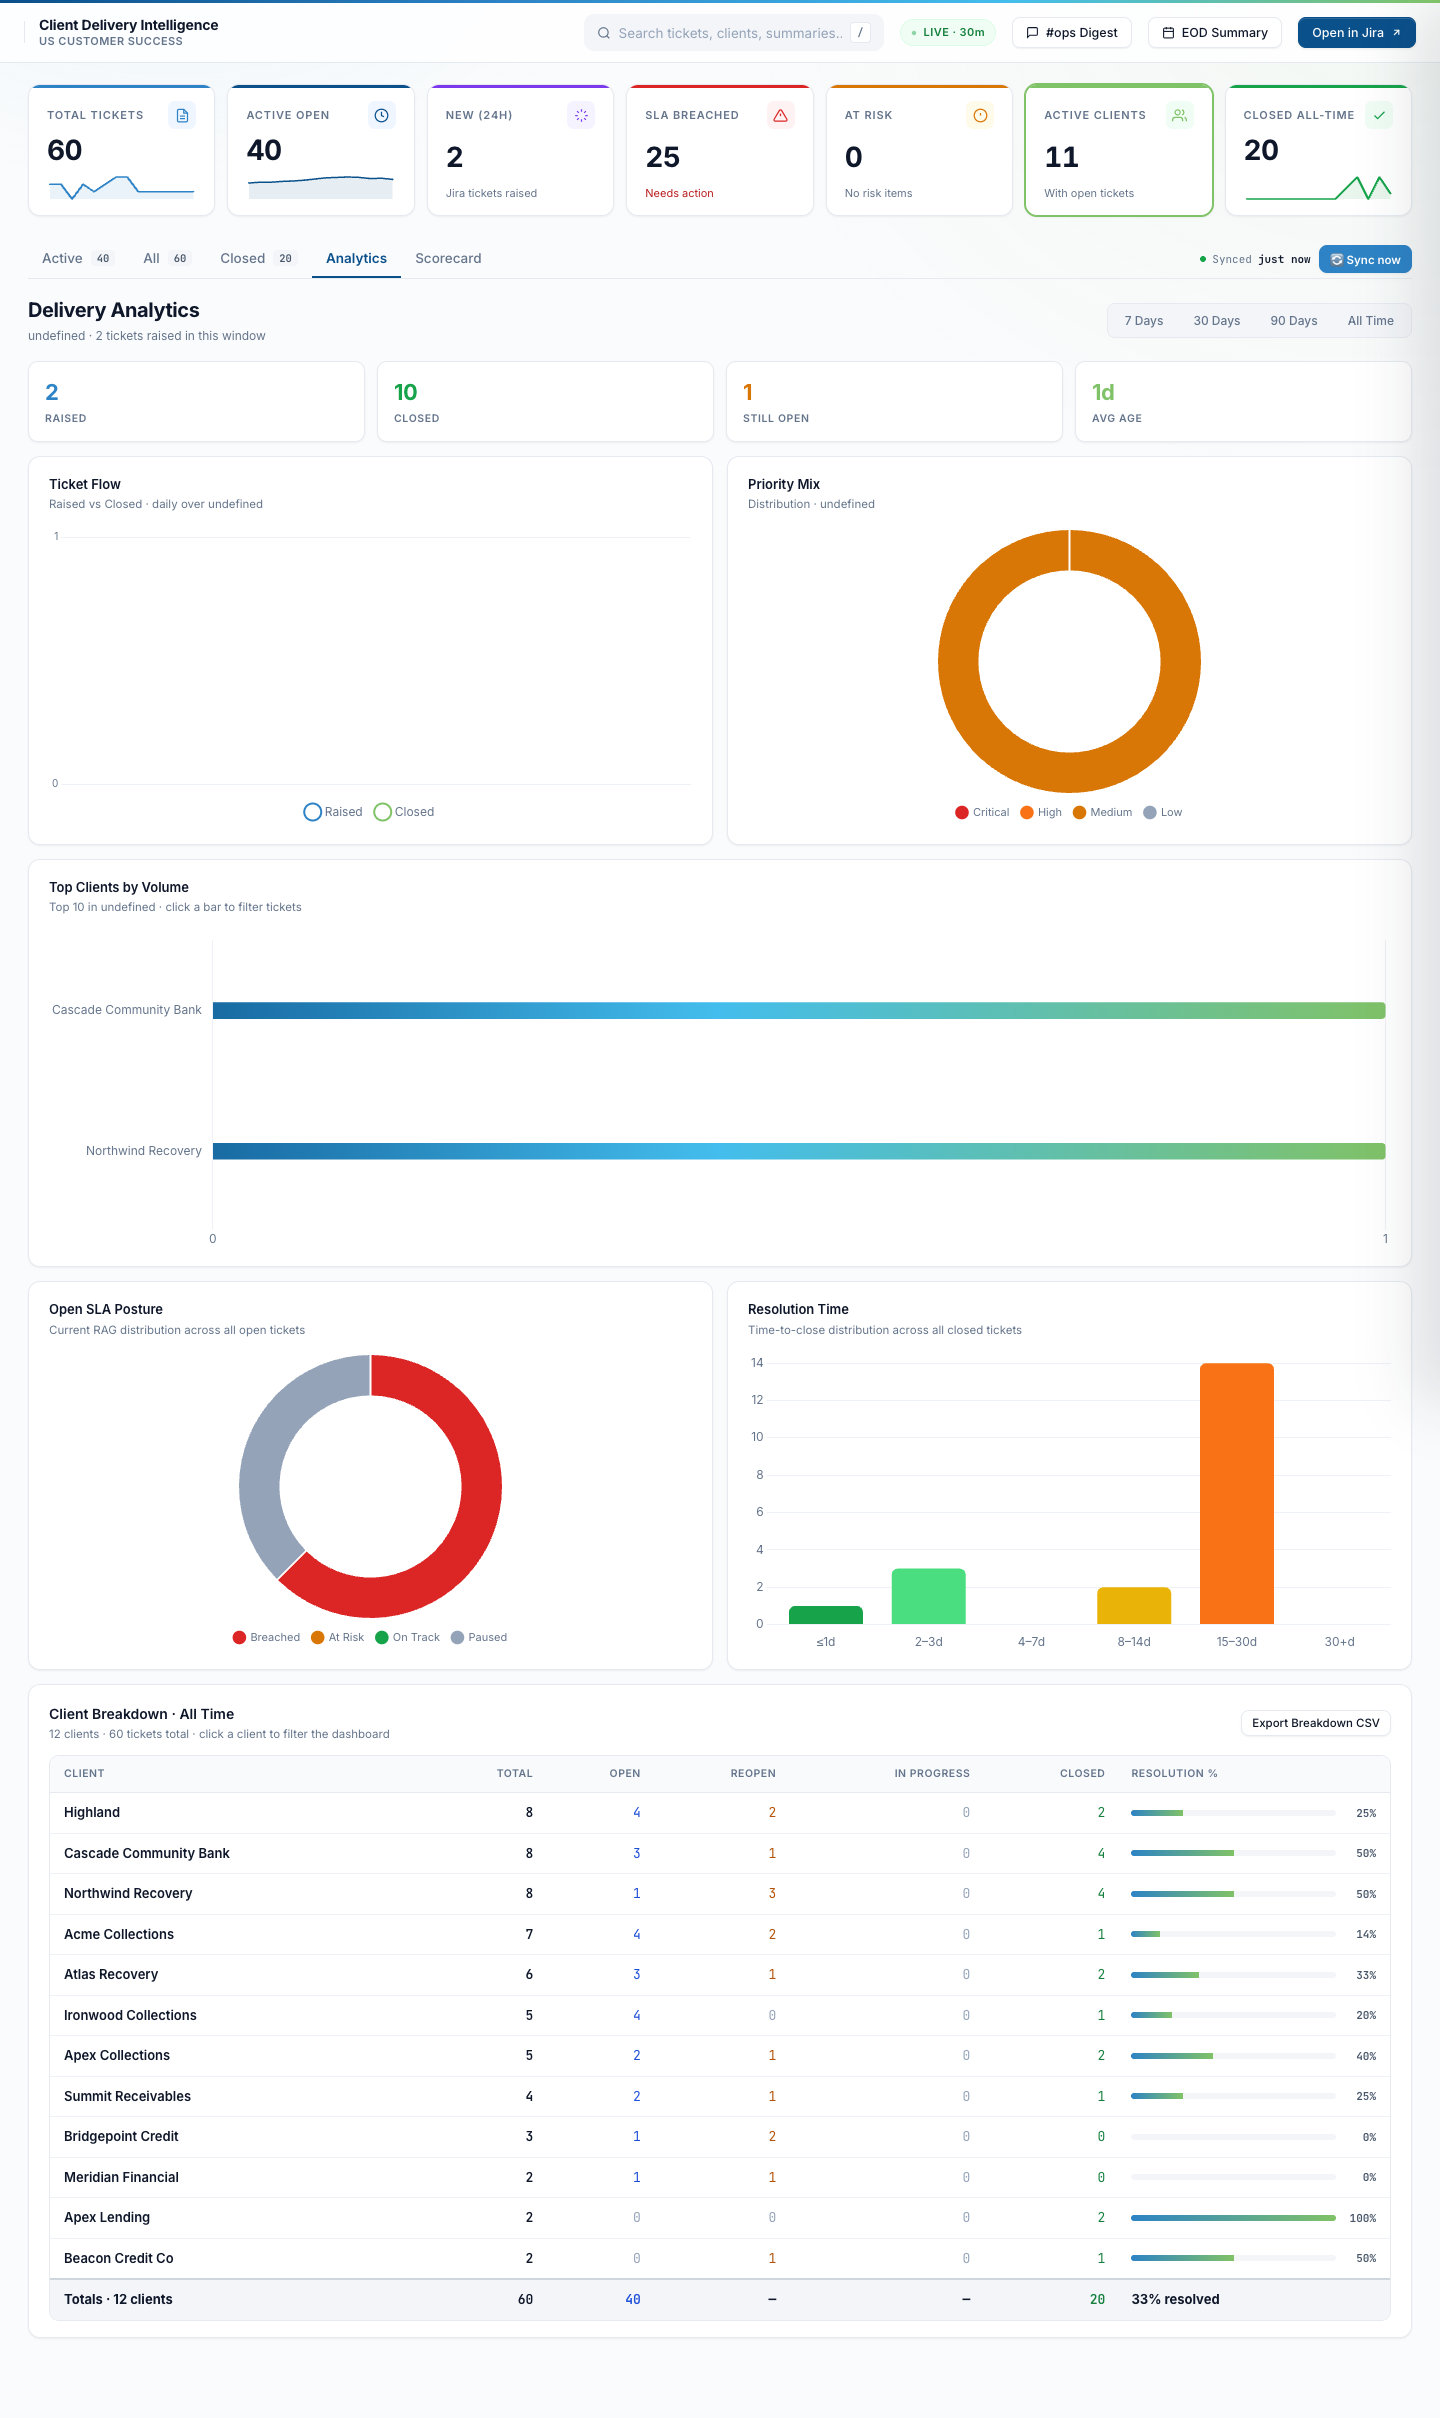
60 tickets raised, 20 closed, 40 still open across the 30-day window. Average ticket age: 17 days. Priority distribution shows Medium dominating, with a smaller High and Low slice.
Analytics — 90-day view (full scroll)
Longer time horizon. Same charts, broader trend. The window switcher snaps between 7 days / 30 days / 90 days / All Time without re-fetching anything — all rendered client-side from the cached data.json.
The dashboard talks to Slack so nobody has to write a digest by hand
A Python script (build_digest.py) assembles the daily digest from the live ticket state, the script (post_digest.py) ships it to Slack via chat.postMessage, and per-ticket sub-threading means replies stay organized. The dashboard exposes a preview-before-post modal so the CS lead can sanity-check the digest before it lands in the team channel.
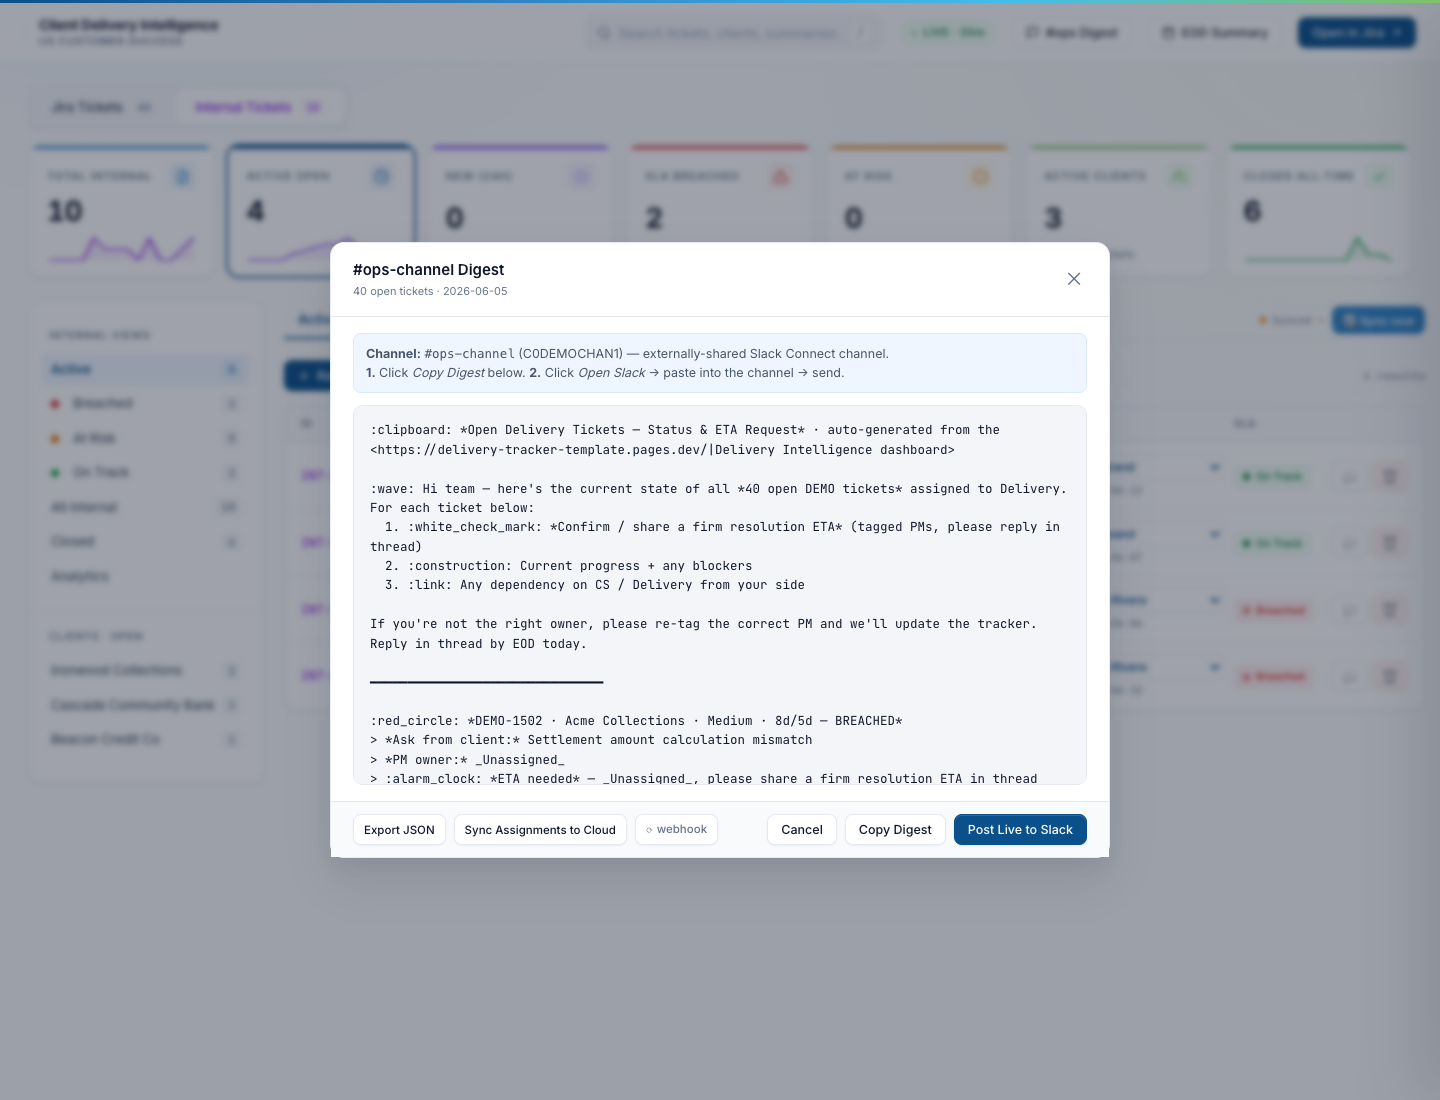
Daily Slack digest — preview before posting
Opens the exact message that will land in the team channel at 2 PM IST. Intro paragraph first (summary of state), then one top-level Slack message per open ticket with status, age, ETA, and SLA chip. Replies thread under each ticket. The “Post Live to Slack” button ships the digest; “Copy Markdown” copies the raw mrkdwn for pasting elsewhere.
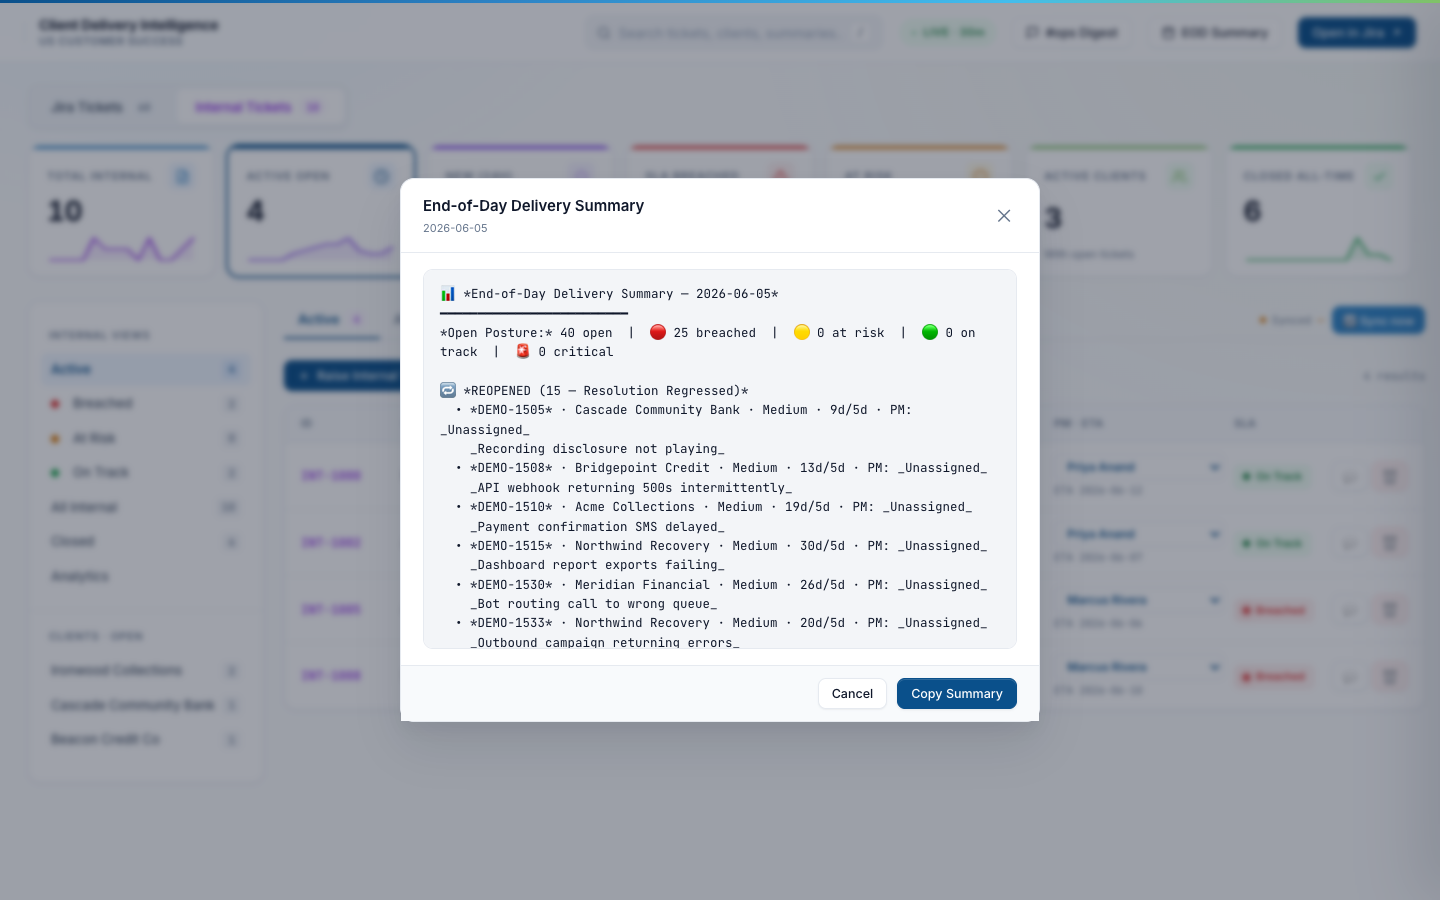
EOD Summary — end-of-day team check-in
A second canned summary the lead can paste into the #ops channel at end of day. Shows tickets that moved status, tickets that breached an SLA, and tickets that closed in the last 24 hours. Skips the noisy stuff (filter changes, comment-only updates).
Every feature that ships in the production system
Beyond the screenshots above, here’s the full surface area. Some of these are small quality-of-life features, some are background automation, some are dashboard ergonomics — together they’re what makes the system actually save 150+ hours/month.
SLA & clock math
Three-clock SLA contract
External tickets track First Response (CSM-owned), First Update (PM-owned), and Time to Resolve (PM-owned) independently. Internal tickets track two (no First Response — they bypass that contract).
Business-hours-aware SLA math
A business day is 12 hours (14:00–02:00 IST, Mon–Fri). All SLA targets count business minutes, not wall-clock. The math lives in sla_tracker.py with a regression test suite.
Auto SLA pause on awaiting_customer
State machine watches the ticket’s awaiting field. The moment it flips to awaiting_customer, the SLA clocks pause and the “PAUSED” chip appears. Auto-resumes on the next customer comment.
Manual SLA pause with reason picker
For situations the state machine can’t infer (e.g. waiting on legal review). The drawer offers a Pause button with a preset reason list. Pauses persist in manual_fields.json across syncs.
Pause queue self-heal
If a pause write fails (Worker offline, GitHub API hiccup), the dashboard keeps the pending pause in a localStorage queue and retries on the next sync. Surfaces a one-click “sync pauses now” banner.
Internal tickets never auto-pause
Internal tickets have no customer in the loop, so awaiting_customer can’t happen. The state machine hard-disables auto-pause for INT-* IDs to prevent the clock-frozen bug we used to see.
Auto-priority decider
Priority level (P0 / P1 / P2 / P3) is derived from the ticket’s label set, summary keywords, and client tier. PMs can override in the drawer; overrides persist immutably in manual_fields.json.
80% SLA breach warning DMs
The breach_warner script DMs the assigned PM when a ticket crosses 80% of its First Update target. One DM per ticket per clock — idempotent via a dedup ledger.
Ticket workflow
Resolved → close toggle (internal tickets)
Each internal ticket has a one-click “Resolved — close ticket” checkbox. Flipping it sets status to Closed, stamps a closing timestamp, and adds a resolution note to the audit trail.
csm_handled (PM response not required)
A drawer toggle for tickets where the CSM resolved without needing the PM. Hides the ticket from the PM scorecard so accountability metrics reflect actual PM work, not random small things the CSM closed.
Awaiting-state derivation
The state_machine.py module reads the comment thread and computes whether the ticket is awaiting_internal (us) or awaiting_customer (them). Drives the auto-pause logic.
RCA / resolution-notes thread
Each ticket has an in-drawer notes thread for findings, hypotheses, and the final RCA. Stamped with author + timestamp, persisted to manual_fields.json, and surfaced in the daily digest.
Related links + attachments
Each ticket can carry related links (Jira sister tickets, Confluence runbooks, dashboards) and attachments (screenshots, log files). Inline edit; multi-line entry.
Immutable manual fields
PM, ETA, action remarks, RCA, sla_pause all live in manual_fields.json and merge spread-style on every write. Prevents the “PM update wiped my pause” class of bug.
Scorecard & reporting
Per-PM scorecard with bar charts
Tickets handled, breached, % First Response Met, % Resolution Met, MTTR, reopens, reopen rate. Bar charts below for open tickets / FR met / Resolution met per PM.
Per-Client & per-Priority groupings
Same metrics regrouped — one switch flips between PM / Client / Priority views. Exposes account-level hotspots and SLA-tier honesty in seconds.
Time-window scoping
7d / 30d / 90d / Lifetime / Custom (date-range picker). Custom range re-aggregates lifetime rows client-side; presets read straight from scorecard.json.
Workspace scope
Jira-only / Internal-only / Both combined. PMs default to their workspace; the “Both” mode is for delivery review where total throughput matters.
Weekly per-PM scorecard auto-post
Every Thursday build_pm_scorecard.py assembles the 7-day per-PM scorecard and posts it to the leadership channel. Same view PMs can pull on demand.
csm_handled tickets auto-excluded from PM metrics
The scorecard pipeline filters out tickets flagged csm_handled before aggregating PM-side metrics. PMs aren’t penalized for tickets the CSM closed without their involvement.
Row drill-down
Click any row in the scorecard table to expand a ticket-by-ticket list with the outcome chip per ticket. Links straight into the ticket drawer.
CSV export
Every scorecard view exports to CSV with one click for downstream Excel / Power BI / Google Sheets work.
AI-assisted triage
“What happened” summary
Each ticket gets a Claude-generated plain-English summary of the issue, regenerated whenever new comments land. Lives in the drawer header so PMs can triage in 10 seconds without reading the full thread.
“Recommended next step”
Below the summary, Claude proposes the next action — “PM to confirm settlement amount; CSM to close the loop” or similar. Saves the “OK what do I do now” pause.
Carry-forward thread context
The fetch_thread_context.py pipeline pulls PM replies from Slack threads back into the daily digest so context carries from yesterday to today.
Regenerate summary on demand
A button in the drawer kicks off a fresh summary if the existing one is stale or wrong — useful after big comment-thread updates.
Slack & notifications
Daily digest at 2 PM IST
Cron fires build_digest.py + post_digest.py. One top-level Slack message per open ticket; intro paragraph first; per-ticket replies thread underneath.
Per-ticket sub-threading
Each digest ticket lands as its own top-level message; reply with PM updates, RCA, “we’re on it”. The next digest carries the latest reply forward.
Silent-thread follow-up nudges
followup_poker.py looks for tickets with no PM reply in 24h+ and nudges the assignee in DM. Idempotent — one nudge per clock per ticket.
New-ticket alerts with dedup ledger
Every newly-synced ticket gets a one-shot Slack alert. A persistent ledger (slack_alerted_tickets.json) prevents duplicate alerts if sync runs twice.
Per-ticket Slack post from drawer
Drawer button posts a status update straight into the ticket’s Slack thread without opening Slack. PM mentions tag the right person automatically via PM_SLACK_IDS.
Bot-message delete from drawer
If a digest message was wrong, one-click delete from the dashboard removes it from Slack via chat.delete. No alt-tabbing.
Filters, search & UX
Filter by client / PM / priority / RAG status
Four orthogonal dropdowns + sidebar pills. Compound filters supported (“Atlas, P1, breached” in three clicks). State persists in localStorage.
Search by ID / client / summary
Top-bar search box. Press / from anywhere to focus. Matches across ticket ID, client, and summary text.
Sortable columns
Click any column header to sort by it. Default: created date descending. Sticky across sessions.
Pagination (25 per page)
Standard pager. Reset on every filter change so the user lands on page 1 of the filtered set.
Sticky filter state
Tab, sub-tab, all filters, sort column, sort direction, scorecard window, scorecard grouping all persist per browser. Open the dashboard tomorrow and you’re where you left off.
Live-sync indicator
Top-right shows when the dashboard last successfully synced. Hover for the exact timestamp + the source freshness (data.json / internal_tickets.json / scorecard.json) per stream.
Automation & infrastructure
30-min sync during business hours
A GitHub Actions workflow runs cloud_sync.py every 30 min from 14:00 to 02:00 IST on weekdays. Off-hours and weekends: 60 min cadence.
One-click manual “Sync now”
Top-right button in the dashboard fires a workflow_dispatch via the Cloudflare Worker proxy. New data lands in ~30 seconds.
JSON-as-database
All state lives in JSON files committed back to a GitHub repo — no DB. Every sync does atomic git pull --rebase -X theirs + write to avoid the 30-min cron silently dying on conflicts.
Cloudflare Worker write-proxy
Browser doesn’t need a GitHub PAT — writes go through a Worker that validates a shared secret then commits via the GitHub Contents API. PAT only lives server-side.
Quota monitor across 5 free tiers
Cron pulls quota usage from GitHub Actions, Cloudflare Workers, Cloudflare Pages, Resend, and Sarvam. Email + Slack alert at 80% to prevent silent outages.
[skip ci] on auto-commits
Sync-generated commits include [skip ci] in the message so Cloudflare Pages doesn’t fire a deploy every 30 minutes and burn the free-tier build cap.
$0/month total cost
Everything fits in free tiers: GitHub Actions (2000 min/mo), Cloudflare Workers (100K req/day), Cloudflare Pages (500 builds/mo), Resend (3K mails/mo), GitHub Pages (1GB).
Auth & security
Per-user email-OTP gate
Visiting any path redirects to an email-entry login. OTP via Resend / Gmail OAuth, 10-min TTL, HMAC-signed 24h session cookie. Rate-limited (5 attempts) and the “does this email exist” lookup leaks nothing.
Email allowlist by domain
Only specific approved emails can ever sign in — even if the team password leaks. Domain-level allowlists for the broader org plus per-user approval for cross-org guests.
Admin approval flow + login notifications
New-user sign-ins fire a Slack DM to the admin with an Approve / Deny pair. Until approved, new users hit a holding page. Successful logins also DM the admin so credential takeover is visible.
One-click sign-in links
For frequently-active whitelisted users, the system can mint single-use magic-link sign-ins delivered via email instead of OTP. 10-minute window; one redemption.
HMAC-signed session cookies
Sessions are JWT-style HMAC-signed (COOKIE_SECRET, 32+ chars). Tampering invalidates. Cookie expires 24h after issue.
Worker-side admin gate
Any write call to the Worker re-checks the email is on the admin list before committing. Even a user with a valid session can’t escalate via direct API call.
What it’s built with
- Frontend
- Single-page web app, vanilla JavaScript (no framework), Chart.js for analytics. ~10K LOC in one HTML file. Optimized for the “one CS lead + one PM scrolling on a laptop” UX.
- Backend automation
- Python:
cloud_sync.py(ticketing sync),sla_tracker.py(business-hours SLA math),state_machine.py(awaiting-state derivation),build_digest.py+post_digest.py(Slack digest),fetch_thread_context.py(carry-forward PM replies),followup_poker.py(silent-thread nudges),breach_warner.py(80% SLA DMs),build_pm_scorecard.py(weekly scorecard). - Edge + cron
- Cloudflare Worker handles scheduled triggers (cron), proxies dashboard writes back to GitHub, and routes Slack events. GitHub Actions runs the long-running sync pipelines on a free-tier schedule.
- Storage
- Plain JSON files committed to a GitHub repo —
data.json,internal_tickets.json,manual_fields.json,scorecard.json,sla_events.json,slack_alerted_tickets.json,client_pm_defaults.json. No database; atomicgit pull --rebase -X theirson every write. - Auth
- Per-user email-OTP on the Cloudflare Pages deployment. Resend / Gmail OAuth for the OTP send. KV store for OTP TTLs and admin allowlist. HMAC-signed session cookies.
- Notifications
- Slack
chat.postMessagewith retry-on-thread (per-ticket sub-threading for replies),chat.deletefor cleanup, DMs for breach warnings and follow-up nudges. Email via Resend (transactional) and Gmail OAuth (production sends). - AI
- Claude (Anthropic) generates the per-ticket “What happened” summary and “Recommended next step” from the comment thread. Same model + pair-programmer role used to build the system.
- Cost
- $0/month. Fits entirely within Cloudflare Workers free tier, Cloudflare Pages free tier, GitHub Actions 2000-min/mo free tier, Resend 3K-mails/mo free tier, GitHub Pages 1GB free tier. Quota monitor pings before any cap.